3. Dashboards
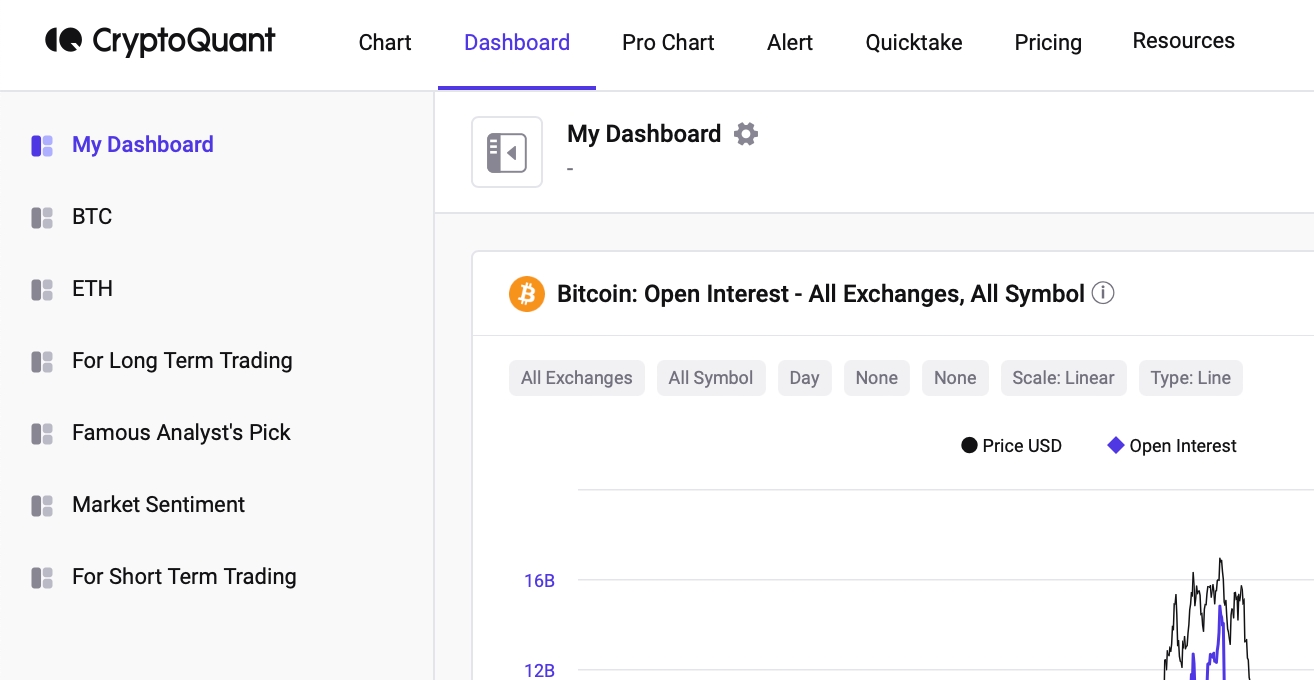
Add the charts of your choice to your dashboard and manage them on one page. You don't need to search for the metrics every time and can compare or analyze the metrics with other indicators without going back and forth.
How to use Dashboards better
Your customized settings will be saved when you add the chart to your dashboard. You do not have to change the resolution, add SMA, or change the scale every time.
You can categorize the charts to manage different kinds of investment analytics or even make a separate dashboard for the public. Click '+ Add Dashboard' to create a new dashboard, and add a new set of charts there. Or copy the existing dashboard to make a new one if you are only making a few changes to the list.

You can add other people's dashboards to yours. If you have the shared link of another user's dashboard, click on Copy to My Dashboard, and it will be added. Or simply click the *star* button and it will be added to your Favorites.

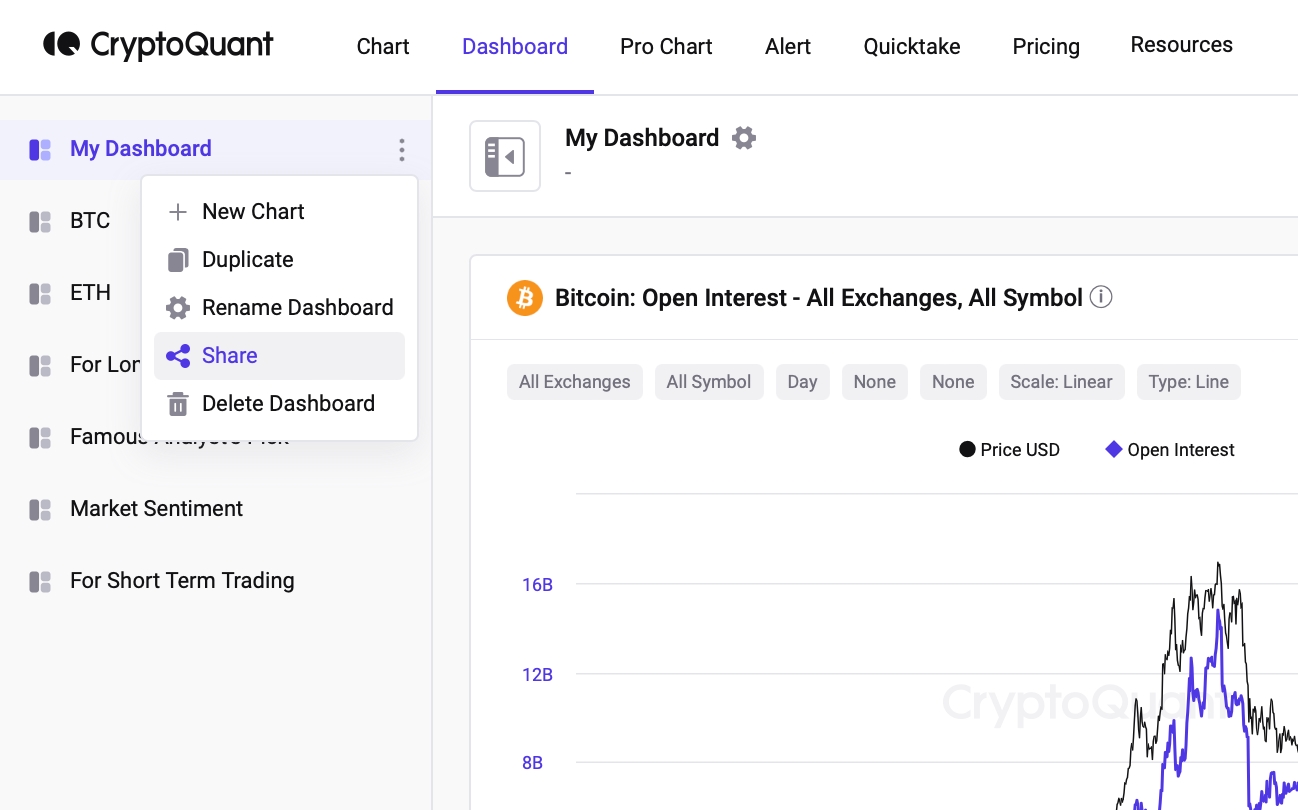
You can share your dashboard with others too. Click the three dots next to the dashboard's name → Click 'Share' → Choose the channel that you would like to share it on or share the URL.

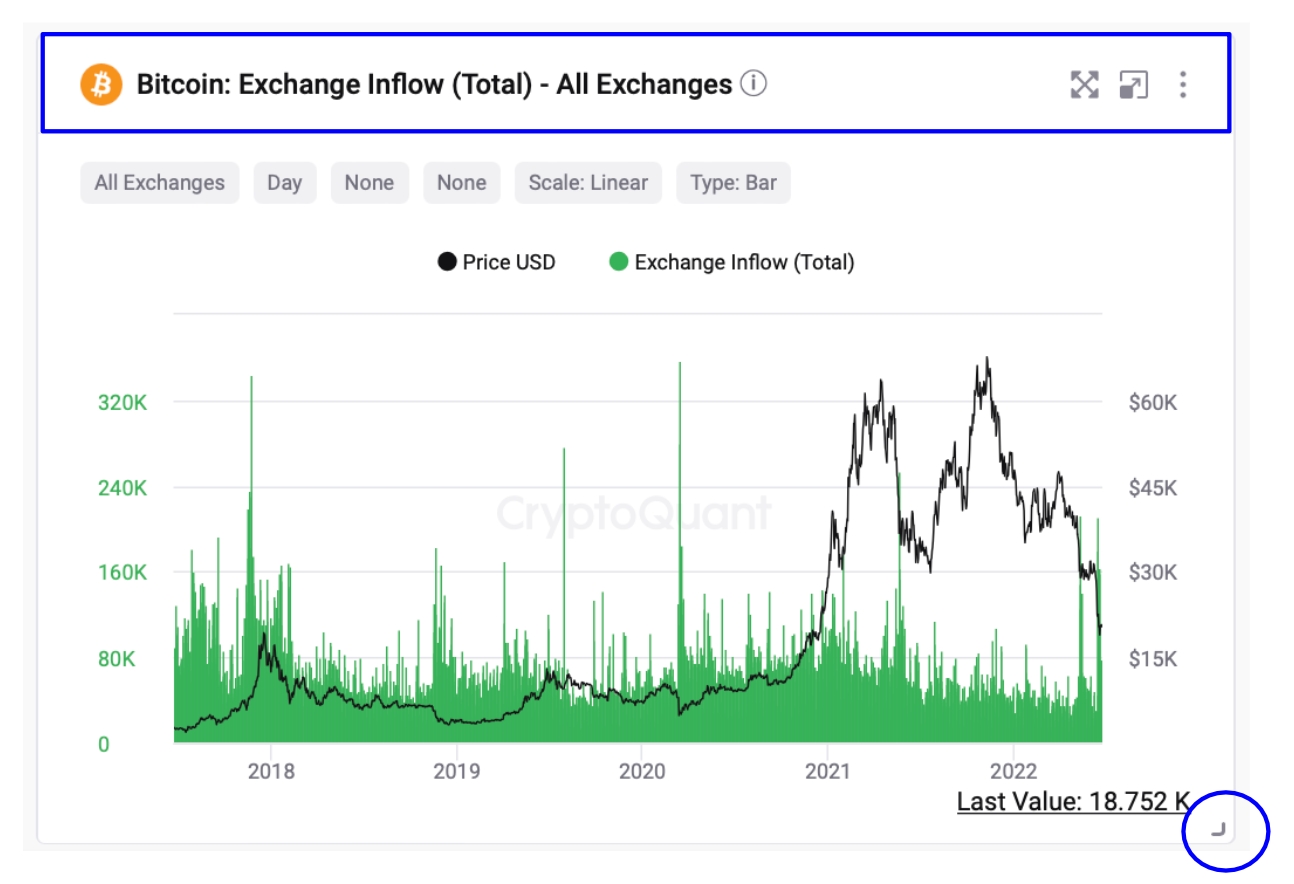
Change the size of charts by clicking and dragging the bottom right corner of the chart.
Arrange your chart's placement by clicking and dragging the top of the chart.

Last updated
Was this helpful?