Overview
Web3 Analytics Tool for Everyone
No-code Analytics Tool
CryptoQuant's no-code analytics does not require prior knowledge of data tools and provides a short learning time compared to any other data platform. Even without prior experience, you can quickly learn to perform advanced data analysis by reading the guide for just about an hour.
If you have a basic understanding of SQL or Excel pivot tables, you can start using the platform immediately without any additional guidance.
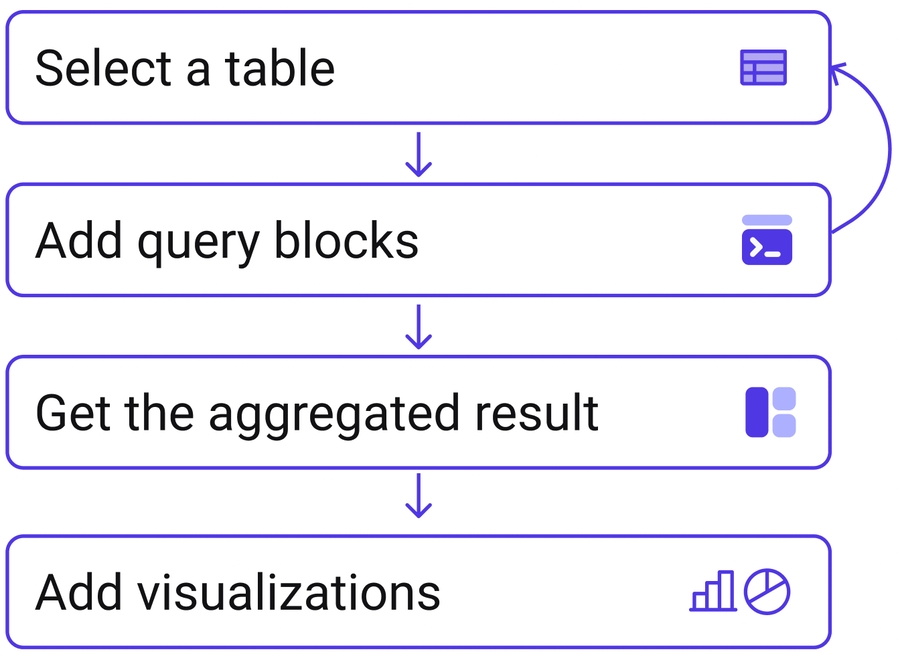
1) Start by selecting a table
The analysis starts by selecting a table that contains the data you would like to see. Options range from raw blockchain data to abstraction tables that organize and categorize complex project data.
Click ‘table preview’ to check the columns and data contained in the table to find out which table to select.
2) Add Query blocks
Metric
This section is where you determine how to process and summarize the chosen data table. In SQL, it is equivalent to a 'SELECT' statement. It supports various arithmetic operations such as sum, count, average, etc.
Data will be calculated by the selected time frame(day, hour, minute…) automatically without the need for additional coding.
ex) If you set the time frame to 'day' and calculate the sum of transaction volume, the daily transaction volume will be displayed automatically.
Where
This section is where you can add conditions and filters to the data selected in Metrics.
ex) If you add an address filter to transaction volume data, transactions related to certain addresses will be calculated.
Use Advanced Filtering feature to get access to CryptoQuant’s wallet label, meta data(basic information on token, NFT, smart contact, etc.), and more.
Group by
This section is where you can create a dimension of the data with a column. The selected data is calculated by the categories in the column.
ex) If you add an address column to group by section when calculating transaction volume, the transaction volume of each address will be displayed.
3) Get the aggregated result
Multiple Query blocks
You can add a new block to the query window if you want to compare data in multiple tables. For example, suppose you want to compare the number of transactions between Ethereum and Bitcoin. In that case, you can add two query blocks, one containing Ethereum data and the other containing Bitcoin data, and compare them.
The added two or more blocks are automatically compared on the time axis based on the time unit set.
The relationship function is used to combine two query blocks based on criteria other than time.
Edit Result
Click Edit Result to carry out arithmetic operations on result tables of 2 query blocks. A new column will be added to the table to allow you to do more than a comparison.
4) Add visualizations
Expand your data using various visualization tools such as combination charts, pie charts, pivot tables, and more.
The options and specifications are customizable to fit your specific needs. Once the charts are created, you can add them to your dashboard for sharing with others.
SQL Mode For Developers
CryptoQuant also offers SQL mode for developers and individuals who are more comfortable using SQL. The syntax is based on BigQuery and additional information can be found in the relevant documentation.
Last updated
Was this helpful?
