Pie
Choose from various display types
Data
Choose the data that you want to show in your Pie chart
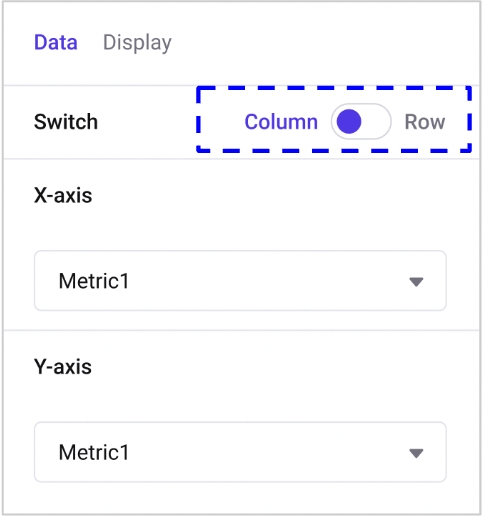
Column / Row
Toggle to choose whether you would like to select values horizontally or vertically from the table.
X Axis: Select a column/row to be used as a dimension
Y Axis: Select columns or a row to display the value
Display
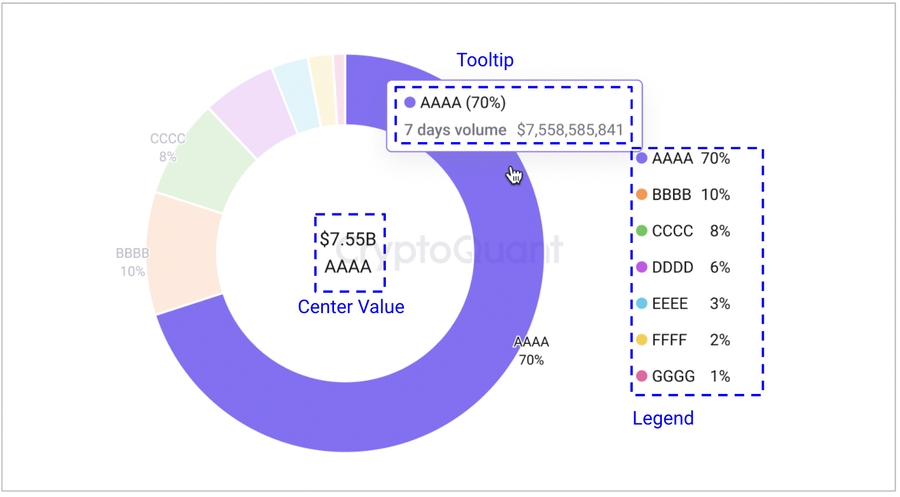
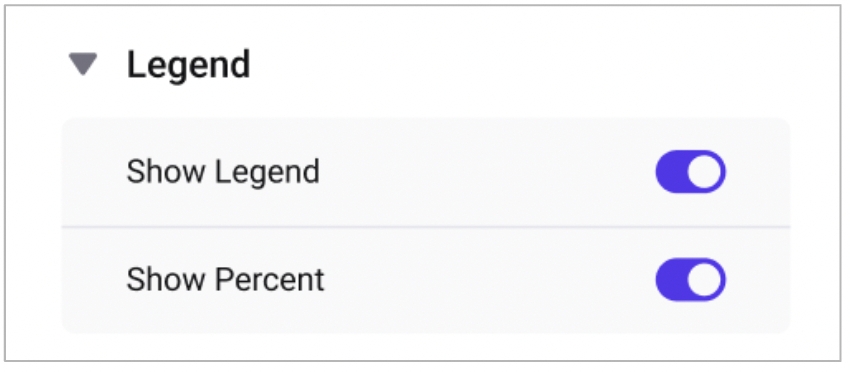
Legend: Check whether you would like to show legend and whether you would like to show percent values together with the legend.
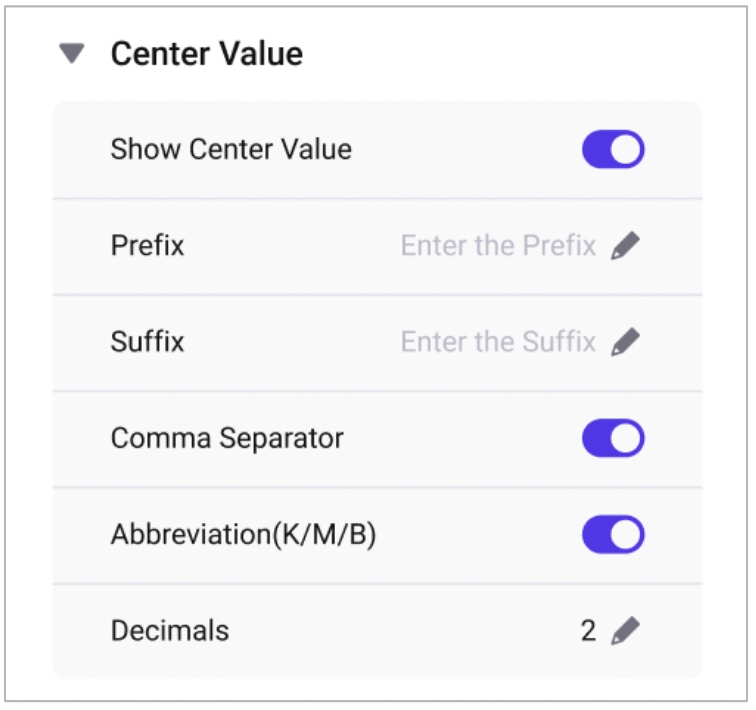
Center Value: Text formatting of the value that appears at the center of the chart.
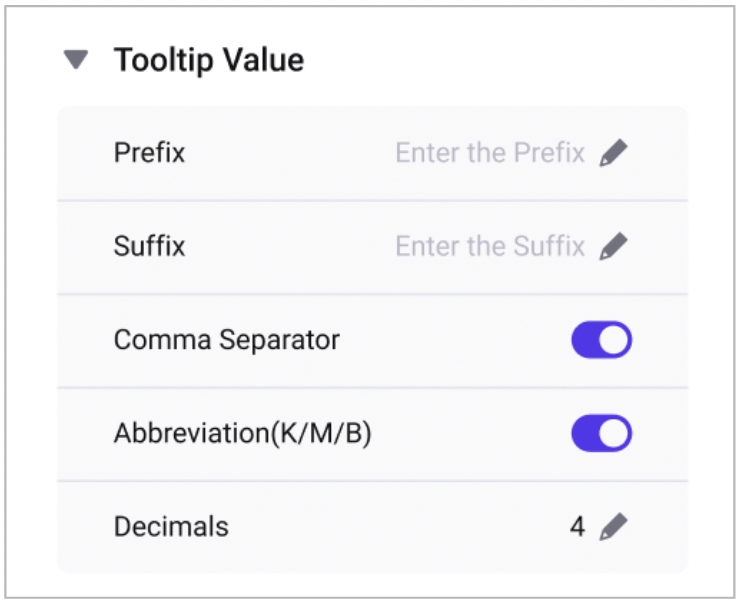
Tooltip Value: Text formatting of the tooltip that appears when you hover your mouse on the chart
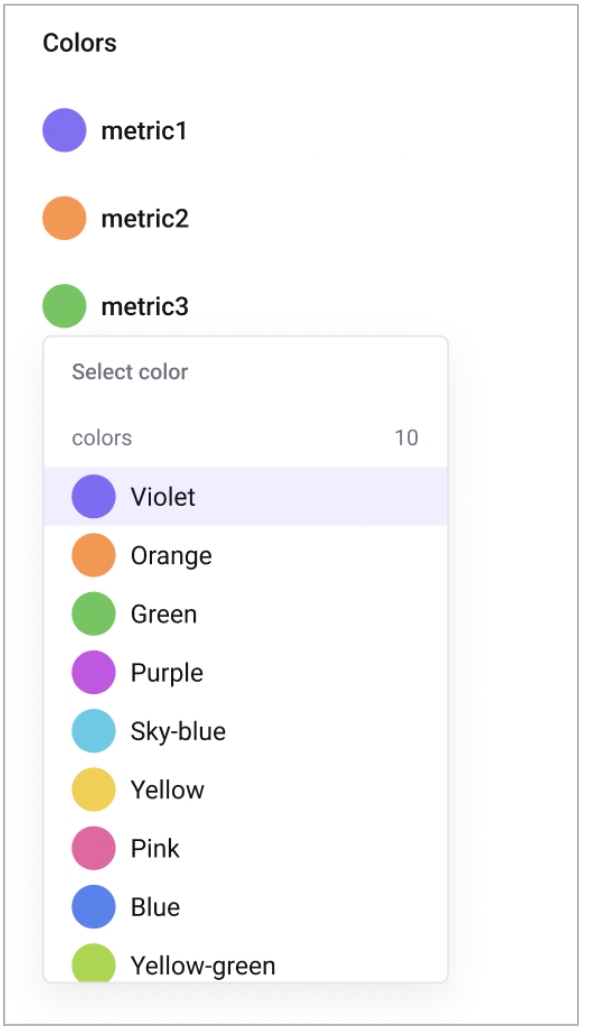
Colors: Set the individual color of each item
Last updated