CryptoQuant User Guide
Vietnamese
Vietnamese
  • 🔍What is CryptoQuant
    • giới thiệu
      • How We Process Data
      • Tại sao lại tin tưởng dữ liệu CryptoQuant?
      • Tại sao lại là thị trường chủ đạo?
    • Kiến thức nền tảng
      • Dữ liệu trên chuỗi là gì?
      • Tại sao thực thể (entity) lại quan trọng?
      • UTxO là gì?
    • Our Product
  • 🎯QuickStart
    • Hướng dẫn dữ liệu 5 phút
      • 3 Dữ liệu On-Chain Chính
      • 3 Dữ liệu Thị trường Chính
      • 3 Chỉ báo Chính
      • Deriving Insights
    • Hướng dẫn tính năng 5 phút
      • 1. Biểu đồ Tổng quan
      • 2. Cảnh báo chính
      • 3. Dashboards
      • 4. Quicktake
      • 5. Top 15 Pro Charts
        • Miner Selling
        • Whale Accumulation
        • Large OTC deals
        • Buying/Selling Pressure
        • Market Trend
        • Market Sentiment
        • Whale Dumping
  • 📊CryptoQuant Metrics
    • Thuật ngữ (Các luồng từ sàn Giao dịch)
      • Dòng vào/ra & Luồng ròng Sàn giao dịch
      • Dự trữ Giao dịch
      • Sàn tới sàn
      • Đếm số lượng địa chỉ Giao dịch
      • Đếm số lượng giao dịch trao đổi
      • Tỷ lệ dòng vốn
      • Tỷ lệ Nguồn cung Giao dịch
      • Dòng vào Giao dịch CDD
      • Dòng vào Giao dịch - Đầu ra Chi tiêu các Dải tuổi
      • Dòng vào Giao dịch - Đầu ra đã Chi tiêu các Dải giá trị
    • Thuật ngữ (Thợ đào)
      • Dòng ra Thợ đào
      • Thợ đào đến Sàn Giao dịch
      • Miners' Position Index (MPI) | Chỉ số Thái độ/Vị trí Thợ đào
      • Tỷ lệ Nguồn cung Thợ đào
    • Thuật ngữ (UTxO)
      • Lãi và Lỗ (UTxO)
      • Lãi và Lỗ (Nguồn cung)
      • Số ngày Tiền xu bị Phá hủy (CDD)
      • Nhị phân CDD
      • Trung bình Tuổi Tiền xu (MCA)
      • Tổng Tuổi Tiền (SCA)
      • Phân bổ Tổng Tuổi Tiền xu (SCA Distribution)
      • Tỷ lệ Lợi nhuận Đầu ra đã Chi tiêu/sử dụng (SOPR)
        • aSOPR
        • STH-SOPR
        • LTH-SOPR
        • SOPR Tỷ lệ (LTH-SOPR/STH-SOPR)
      • Lãi và Lỗ Ròng chưa hiện thực (NUPL)
      • UTXO Các Dải (Tuổi)
        • UTXO Các dải Tuổi
        • Vốn hóa thực tế - Các dải Tuổi UTXO
        • Giá thực tế - Các dải tuổi UTXO
        • Số lượng UTXO - Các dải tuổi
        • Các Dải Tuổi Đầu ra đã Sử dụng/Chi tiêu
      • UTXO Bands (Value)
        • Các dải Giá trị UTXO
        • Vốn hóa thực tế - UTXO Các dải Giá trị USD
        • Số lượng UTXO - Các dải Giá trị
        • Các dải Giá trị Đầu ra đã Chi tiêu/Sử dụng
    • Thuật ngữ (Thị trường)
      • Open Interest
      • Funding Rates
      • Tỷ lệ đòn bẩy ước tính
      • Taker Mua Bán Khối lượng/Tỷ lệ
      • Các mô hình Vốn hóa
      • Giá thực tế
      • Tỷ lệ Cá voi Giao dịch
      • Tỷ lệ MVRV
    • Network Indicators
      • Tỷ lệ NVT
      • Giao cắt Vàng NVT
      • Puell Multiple
      • Tỷ lệ Stock to Flow
      • Chuyển đổi Stock to Flow
      • Tỷ lệ NVM
    • Thuật ngữ (Tiền ổn định)
      • Stablecoin Dữ liệu Mạng
      • Stablecoin Dòng Vào/Ra & Luồng Ròng Giao dịch
      • Dự trữ Tiền ổn định Sàn Giao dịch
      • Số lượng các địa chỉ sàn giao dịch Tiền ổn định
      • Số lượng các Giao dịch Tiền ổn định
      • Tỷ lệ các Đồng tiền ổn định
      • Tỷ lệ Nguồn cung Tiền ổn định (SSR)
    • Fund Data & Premium
      • Grayscale Bitcoin Trust (GBTC)
        • GBTC Nắm giữ tài sản kỹ thuật số
        • GBTC Premium hoặc Chiết khấu
      • Grayscale Ethereum Trust (ETHE)
        • ETHE Nắm giữ tài sản kỹ thuật số
        • ETHE Premium hoặc Chiết khấu
      • Coinbase Premium
      • Chỉ số Korea Premium
      • Tỷ lệ Nguồn cung Ngân hàng
  • 🛠️Web3 Analytics Tool
    • Overview
    • Data Table Navigation
    • How to Use
      • 1. DateTime Aggregation
      • 2. Query Block - Metric
      • 3. Query Block - Where
      • 4. Query Block - Group by
      • 5. Query Block - Join
      • 6. Query Block - Order by
      • 7. Save and Run
      • 8. Editing the Result
      • 9. Visualization
        • Table
        • Pie
        • Serial
        • Number
        • Pivot Table
  • 📌Reference
    • FAQ
    • Community Guidelines
    • Community Links
Powered by GitBook
On this page
  • No-code Analytics Tool
  • 1) Start by selecting a table
  • 2) Add Query blocks
  • 3) Get the aggregated result
  • 4) Add visualizations
  • SQL Mode For Developers

Was this helpful?

  1. Web3 Analytics Tool

Overview

Web3 Analytics Tool for Everyone

PreviousTỷ lệ Nguồn cung Ngân hàngNextData Table Navigation

Last updated 1 year ago

Was this helpful?

No-code Analytics Tool

CryptoQuant's no-code analytics does not require prior knowledge of data tools and provides a short learning time compared to any other data platform. Even without prior experience, you can quickly learn to perform advanced data analysis by reading the guide for just about an hour.

If you have a basic understanding of SQL or Excel pivot tables, you can start using the platform immediately without any additional guidance.

1) Start by selecting a table

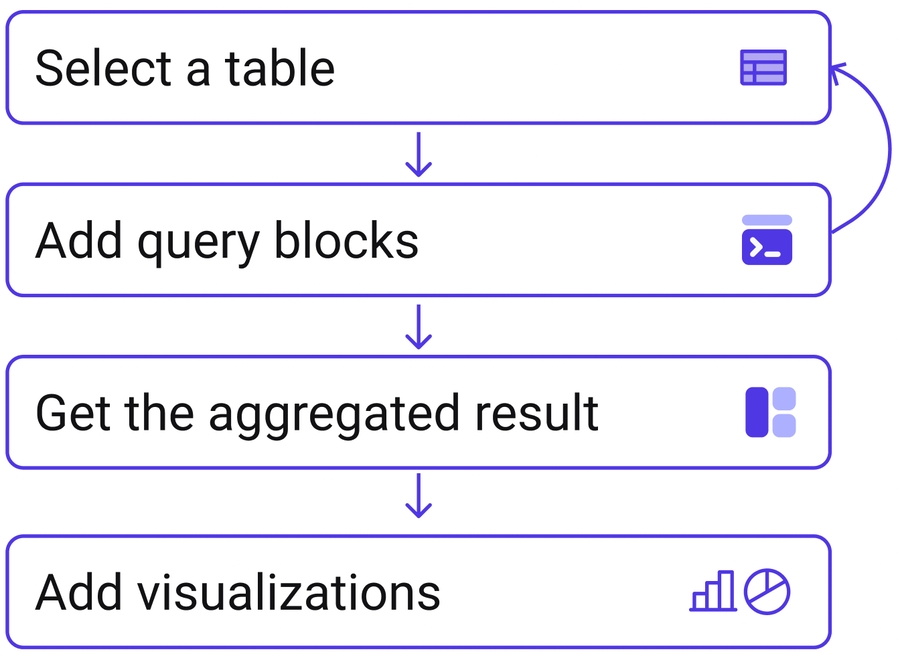
The analysis starts by selecting a table that contains the data you would like to see. Options range from raw blockchain data to abstraction tables that organize and categorize complex project data.

Click ‘table preview’ to check the columns and data contained in the table to find out which table to select.

2) Add Query blocks

Metric

This section is where you determine how to process and summarize the chosen data table. In SQL, it is equivalent to a 'SELECT' statement. It supports various arithmetic operations such as sum, count, average, etc.

Data will be calculated by the selected time frame(day, hour, minute…) automatically without the need for additional coding.

ex) If you set the time frame to 'day' and calculate the sum of transaction volume, the daily transaction volume will be displayed automatically.

Where

This section is where you can add conditions and filters to the data selected in Metrics.

ex) If you add an address filter to transaction volume data, transactions related to certain addresses will be calculated.

Use Advanced Filtering feature to get access to CryptoQuant’s wallet label, meta data(basic information on token, NFT, smart contact, etc.), and more.

Group by

This section is where you can create a dimension of the data with a column. The selected data is calculated by the categories in the column.

ex) If you add an address column to group by section when calculating transaction volume, the transaction volume of each address will be displayed.

3) Get the aggregated result

Multiple Query blocks

You can add a new block to the query window if you want to compare data in multiple tables. For example, suppose you want to compare the number of transactions between Ethereum and Bitcoin. In that case, you can add two query blocks, one containing Ethereum data and the other containing Bitcoin data, and compare them.

The added two or more blocks are automatically compared on the time axis based on the time unit set.

The relationship function is used to combine two query blocks based on criteria other than time.

Edit Result

Click Edit Result to carry out arithmetic operations on result tables of 2 query blocks. A new column will be added to the table to allow you to do more than a comparison.

4) Add visualizations

Expand your data using various visualization tools such as combination charts, pie charts, pivot tables, and more.

The options and specifications are customizable to fit your specific needs. Once the charts are created, you can add them to your dashboard for sharing with others.


SQL Mode For Developers

CryptoQuant also offers SQL mode for developers and individuals who are more comfortable using SQL. The syntax is based on BigQuery and additional information can be found in the relevant documentation.

🛠️