> For the complete documentation index, see [llms.txt](https://userguide.cryptoquant.com/llms.txt). Markdown versions of documentation pages are available by appending `.md` to page URLs; this page is available as [Markdown](https://userguide.cryptoquant.com/cryptoquant-metrics/market/capitalization-models.md).
# Capitalization models
### Alternative Capitalization Models
The market price itself can be easily manipulated by forces, especially in cryptocurrency markets, which we call noise. In order not to be fooled by market price, traders need to see multiple **alternative capitalization models** to see how the market is going.
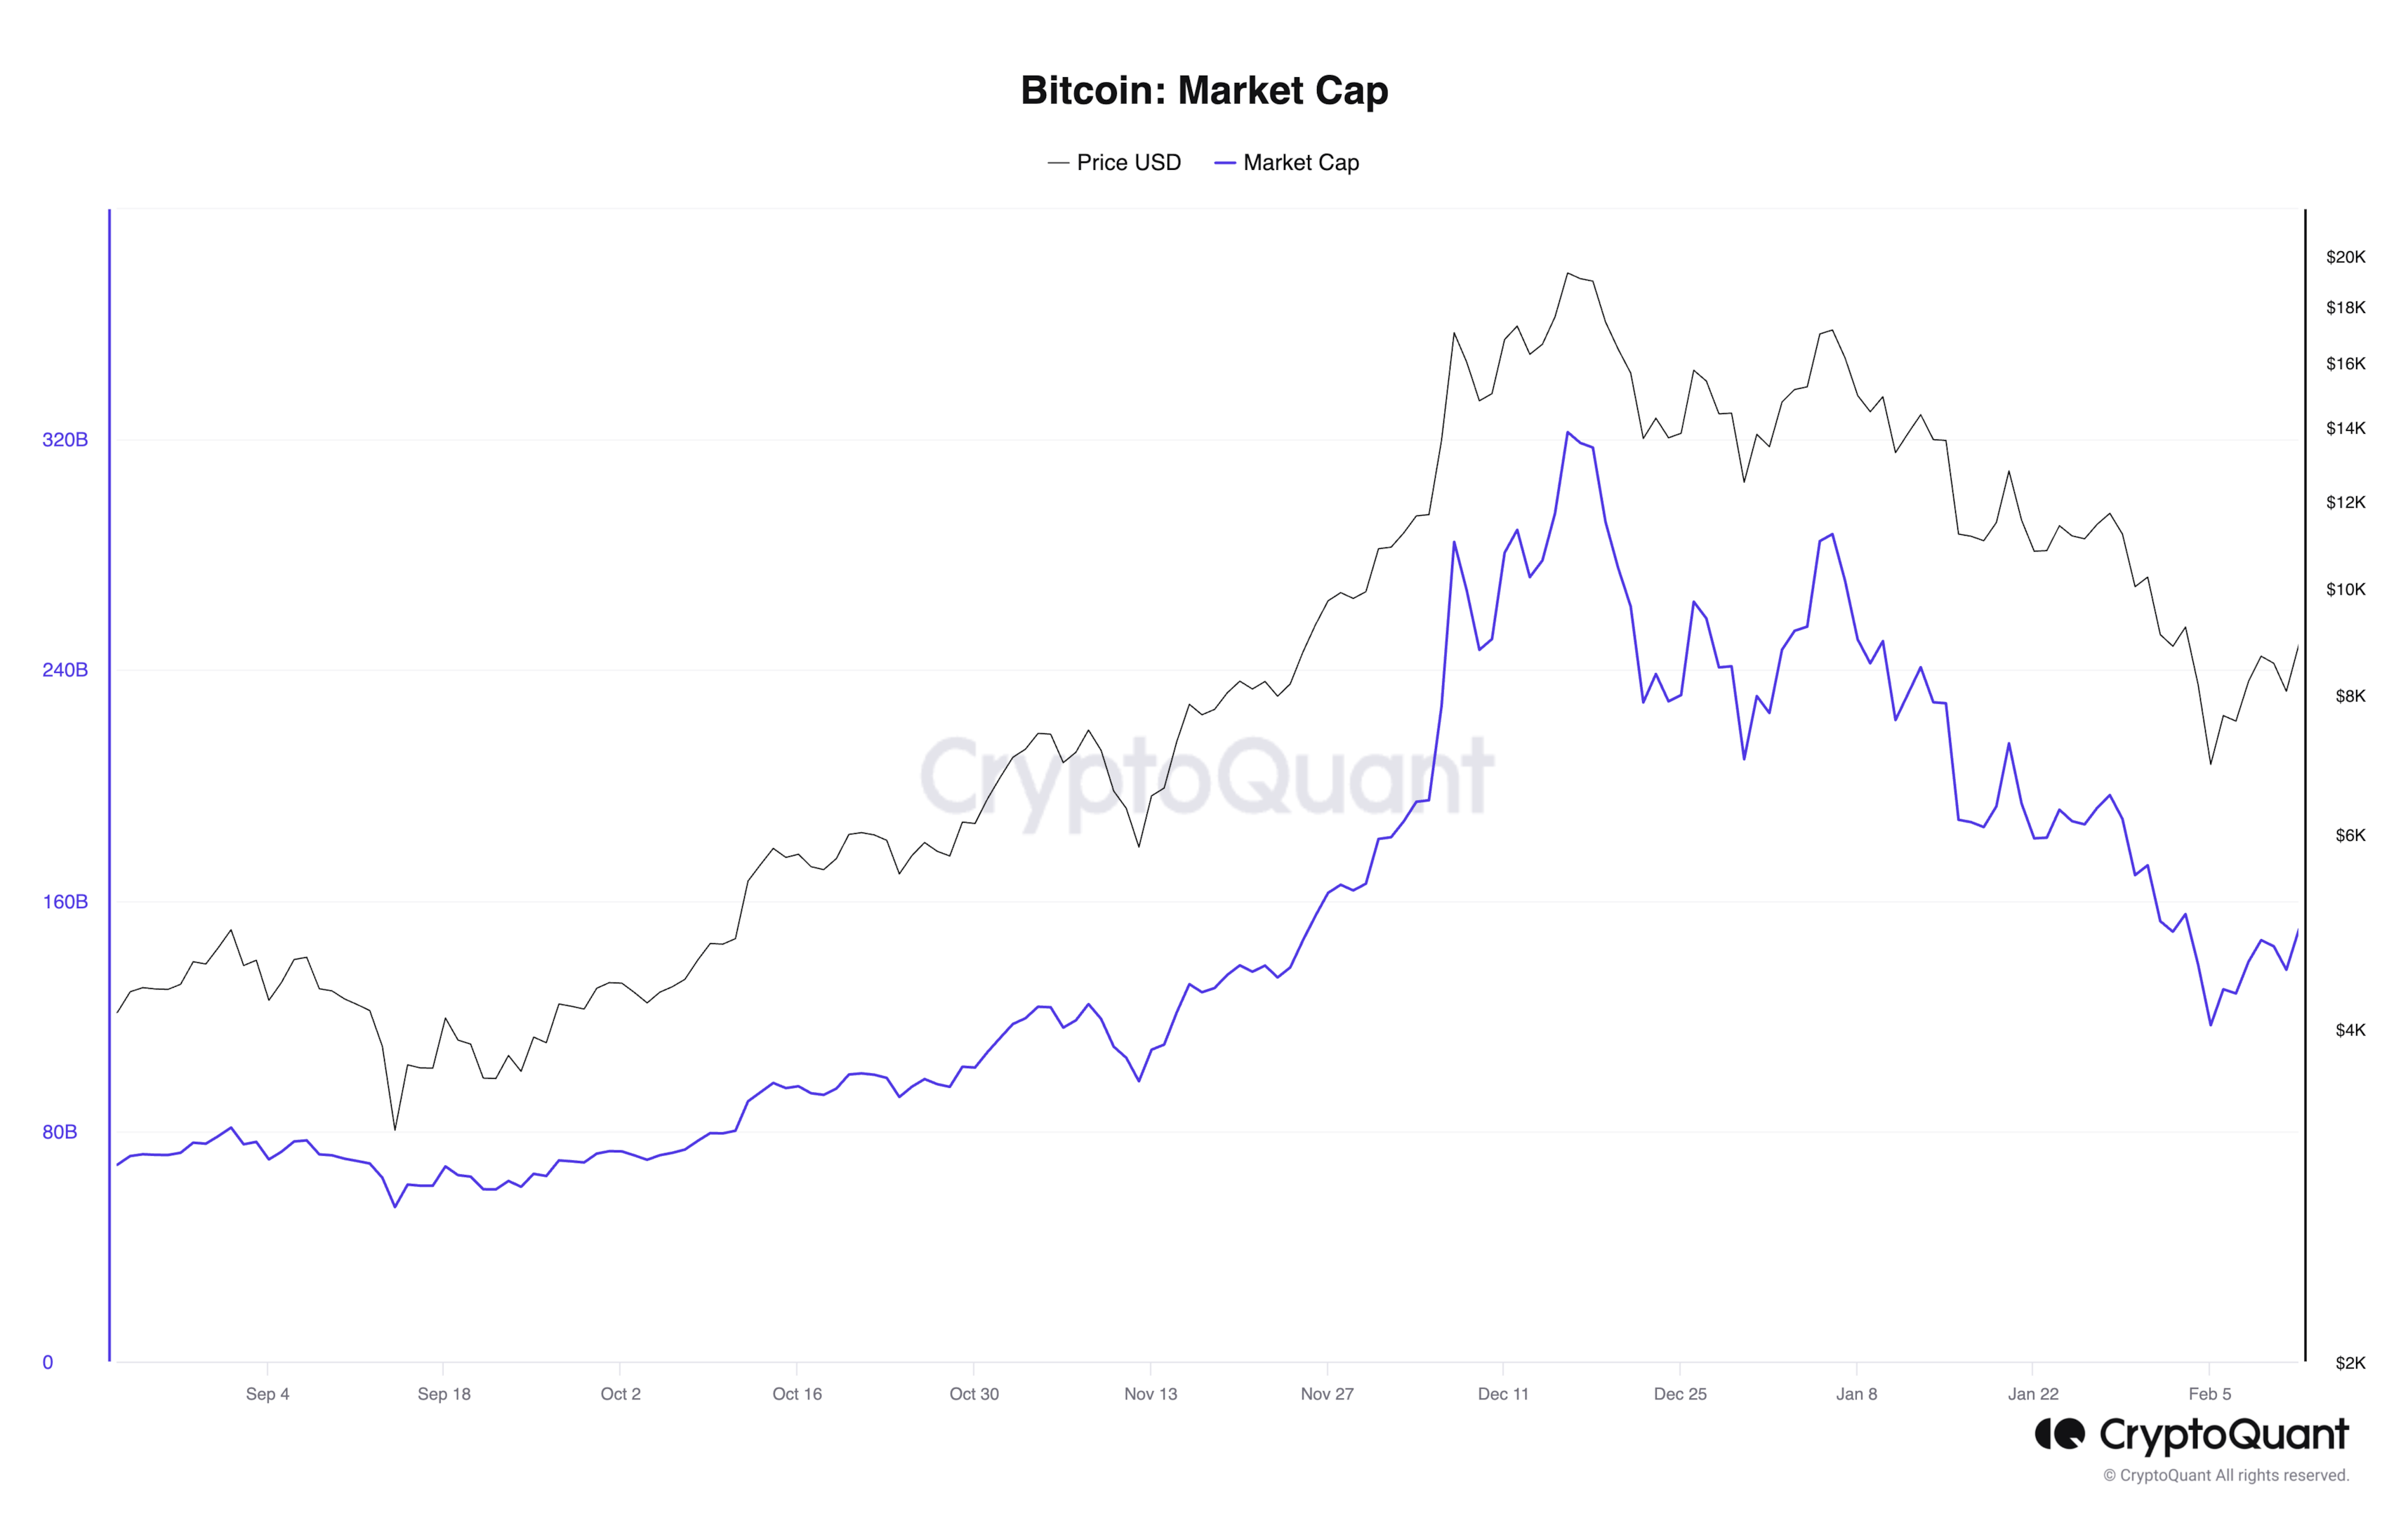
#### Market Cap
Market Cap is defined as the total market capitalization of the coin, calculated by multiplying the total supply with its USD price.
$$
\text{Market Cap} = \text{Total Supply} \* \text{Price in USD}
$$
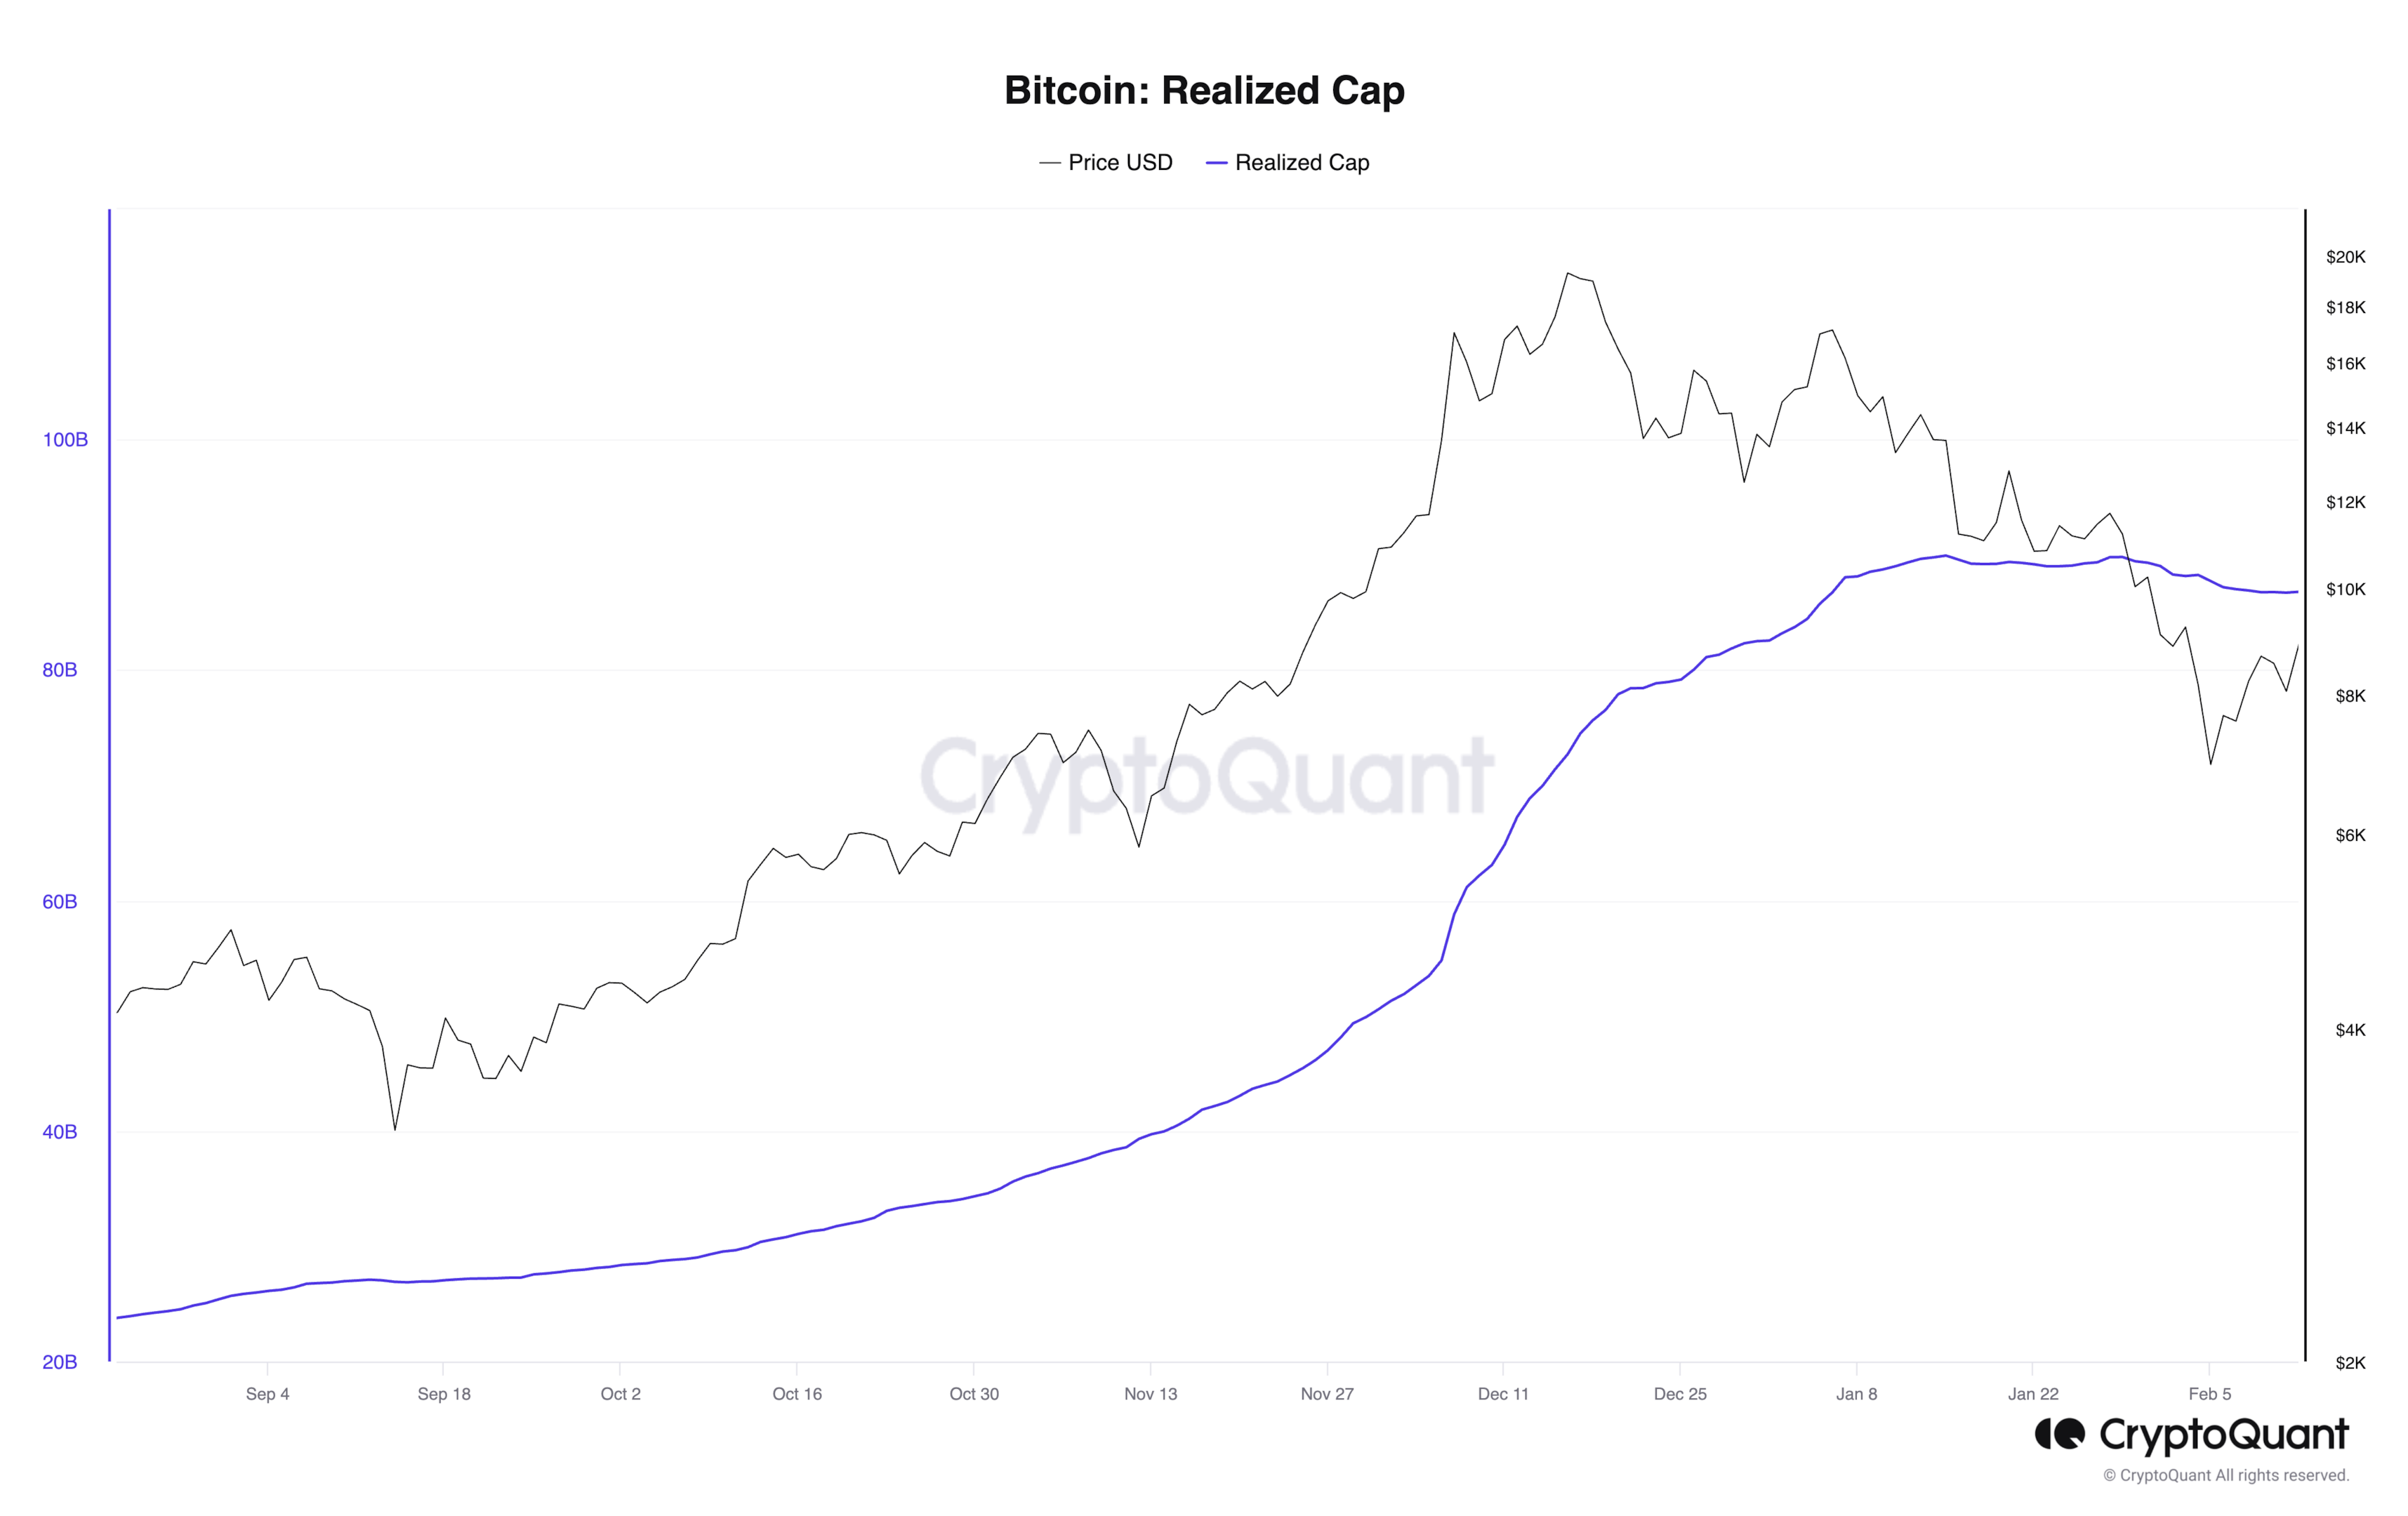
#### Realized Cap
Realized Cap is the sum of each UTXO \* last movement price. Since cryptocurrencies can be lost, unclaimed, or unreachable through various bugs, Realized Cap is introduced to discount those coins which have remained unmoved for a long period. It is one way to attempt to measure the value of the coin. This can be described as an on-chain version of the volume-weighted average price (VWAP).
$$
\text{Realized Cap} = \sum\_i \text{UTXO}\_i \* \text{Price at creation}
$$
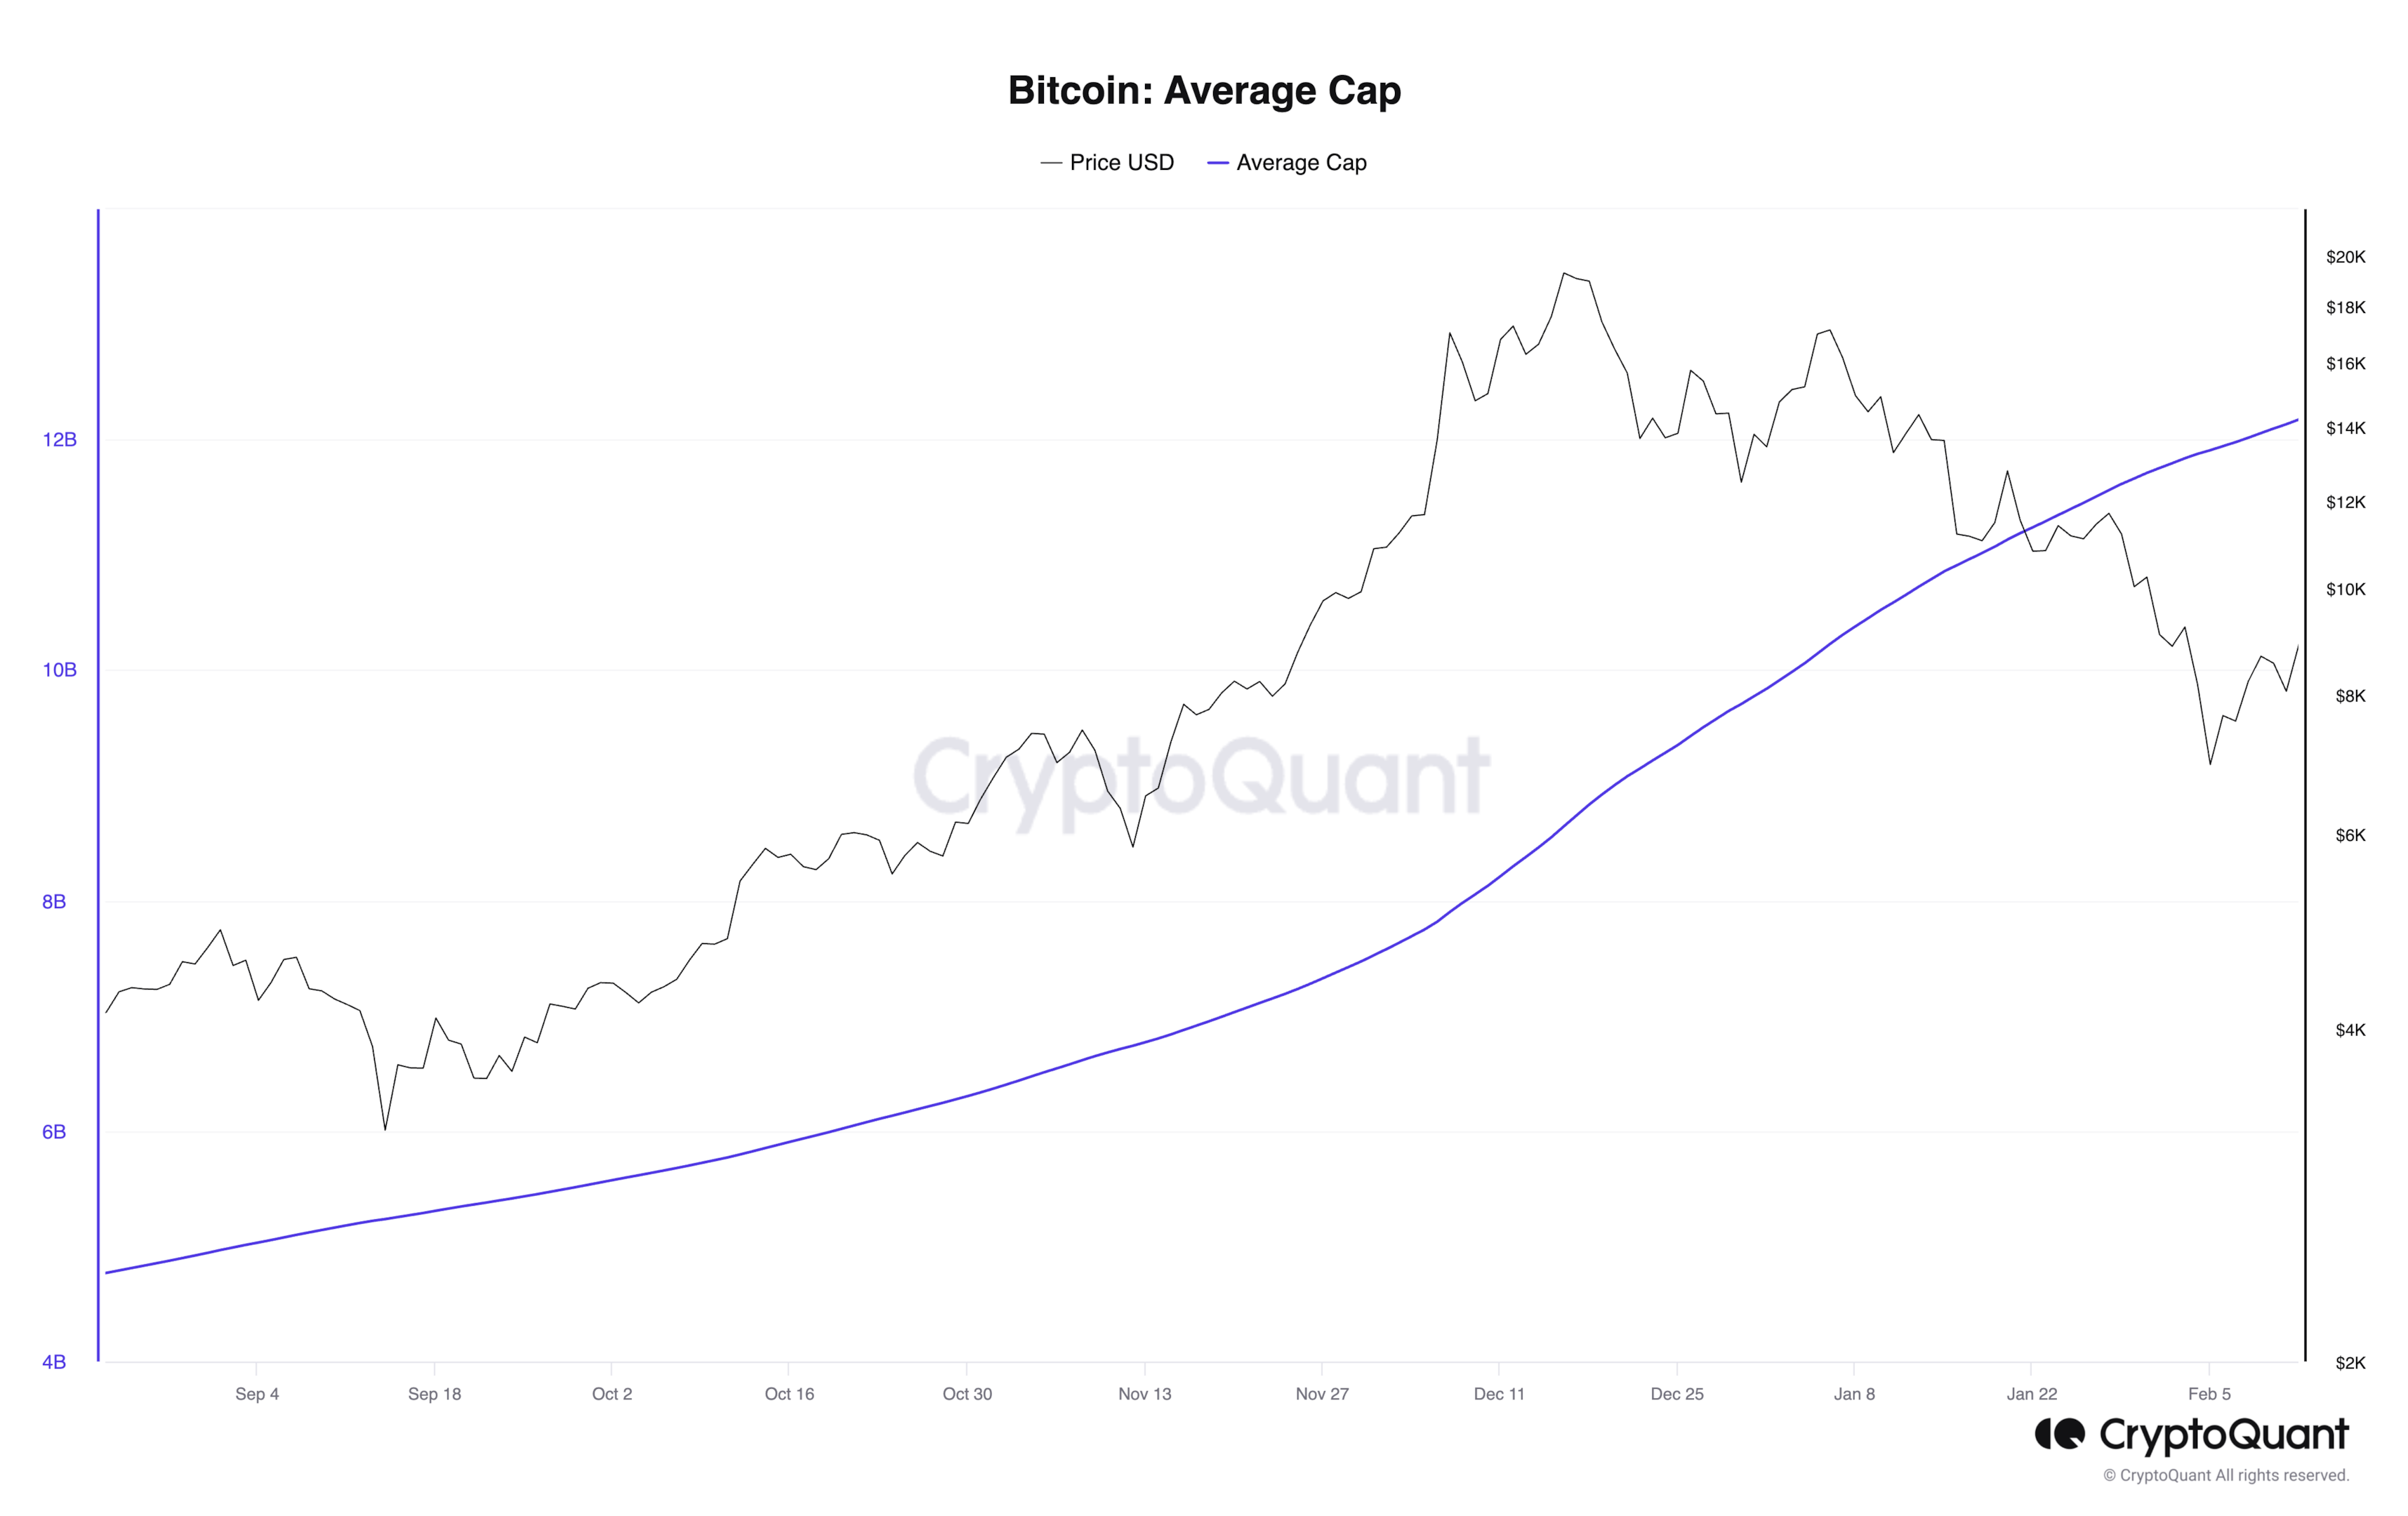
#### Average Cap
Average Cap is a forever moving average, calculated by dividing the cumulated sum of daily market cap by the age of the market. Instead of using fixed time for calculating the moving average (e.g. 50 days, 100 days ...), this serves as the true mean.
$$
\text{Average Cap} = \frac{\text{Market Cap}}{\text{Age in days}}
$$
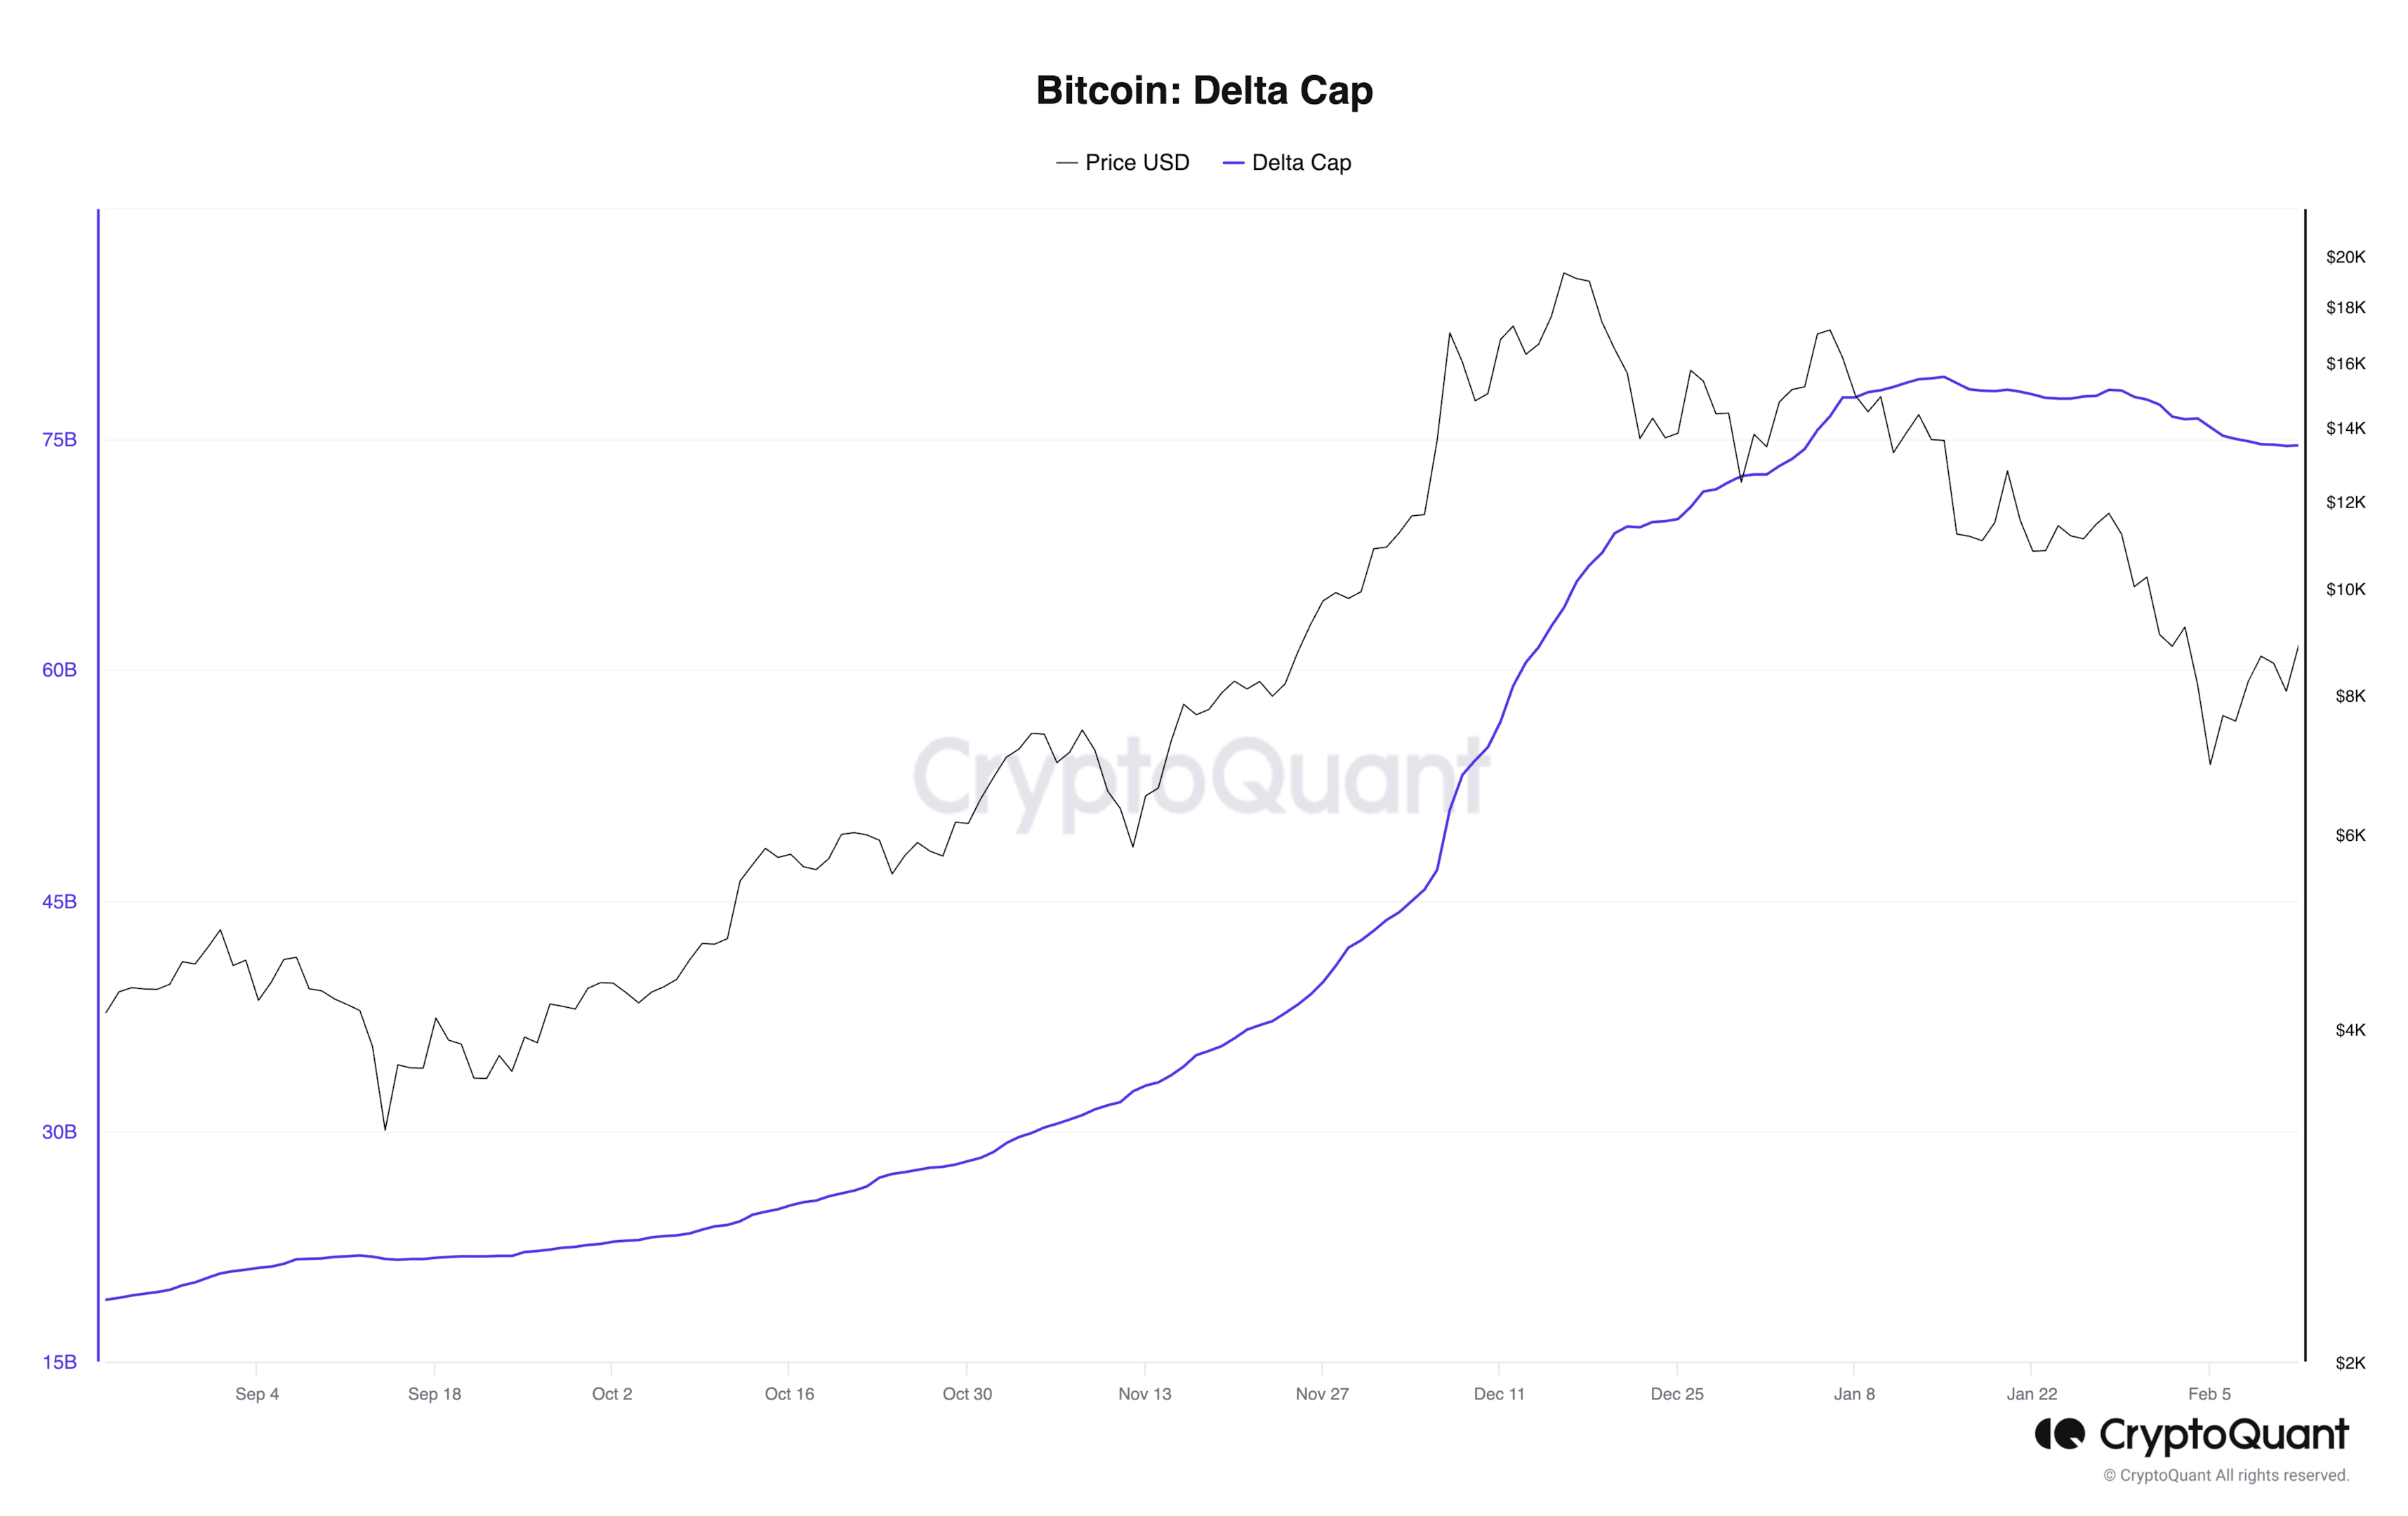
#### Delta Cap
Delta Cap is calculated as the subtraction of Realized Cap to Average Cap. Delta Cap is often used to spot market bottoms. Moreover, by analyzing the movement of Delta Cap which oscillates between Realized Cap and Average Cap, we could notice that market tops are reached when Delta Cap is near Realized Cap (in a log scaled chart).
$$
\text{Delta Cap} = \text{Realized Cap} - \text{Average Cap}
$$
#### Thermo Cap (Inflows Cap)
Thermo Cap is calculated as the weighted sum of mined coins by the creation price. This measures total capitalization flowed into the blockchain network, which in turn is to be called as Inflows Cap. As shown in the below figure, by comparing to Market Cap, Thermo Cap allows traders to spot market tops or bottoms.
Smaller gap between market cap and thermo cap allows to see market bottoms as shown in red boxes.
## Final Note
In conclusion, navigating the volatile terrain of cryptocurrency markets demands a nuanced understanding that goes beyond the simplicity of market prices. Alternative capitalization models serve as indispensable tools for the discerning investor, offering a more comprehensive perspective and mitigating the impact of market noise.
The Market Cap, a fundamental metric and capitalization model, computes the total market capitalization by multiplying the coin's total supply with its USD price. Realized Cap, on the other hand, factors in the movement of coins over time, discounting those that have remained stagnant. This provides a more accurate reflection of a coin's value, akin to an on-chain version of the volume-weighted average price.
The Average Cap introduces a dynamic element, eschewing fixed time frames and offering a moving average calculated by dividing the cumulative sum of daily market cap by the age of the market. Delta Cap, the subtraction of Realized Cap from Average Cap, becomes a valuable tool for identifying market bottoms and tops. Analyzing the oscillation of Delta Cap between Realized Cap and Average Cap unveils potential market trends, particularly when Delta Cap nears Realized Cap in a log-scaled chart.
Thermo Cap, or Inflows Cap, serves as a weighted sum of mined coins by creation price, unveiling the total capitalization flowing into the blockchain network. Comparing Thermo Cap to Market Cap enables traders to identify market tops or bottoms, with a smaller gap indicating potential market bottoms.
In this dynamic landscape, where words like "volatility" and "uncertainty" are divided by the innovative spirit of blockchain, these alternative capitalization models represent a forward-looking method for traders looking to make an investment. By incorporating these measures into their analyses, traders can present a more nuanced understanding of market dynamics, better equipped to navigate the present and future of cryptocurrency markets.
## Links to our Data
* [Market Cap in CryptoQuant Live Chart](https://cryptoquant.com/overview/full/471?window=day)
* [Realized Cap in CryptoQuant Live Chart](https://cryptoquant.com/overview/full/194?window=day)
* [Average Cap in CryptoQuant Live Chart](https://cryptoquant.com/overview/full/195?window=day)
* [Delta Cap in CryptoQuant Live Chart](https://cryptoquant.com/overview/full/196?window=day)
* [Thermo Cap in CryptoQuant Live Chart](https://cryptoquant.com/overview/full/472?window=day)
* [Capitalization models in CryptoQuant Data API docs](https://cryptoquant.com/docs/#operation/getCapitalization)
---
# Agent Instructions
This documentation is published with GitBook. GitBook is the documentation platform designed so that both humans and AI agents can read, navigate, and reason over technical content effectively. Learn more at gitbook.com.
## Querying This Documentation
If you need additional information that is not directly available in this page, you can query the documentation dynamically by asking a question.
Perform an HTTP GET request on the current page URL with the `ask` query parameter, and the optional `goal` query parameter:
```
GET https://userguide.cryptoquant.com/cryptoquant-metrics/market/capitalization-models.md?ask=&goal=
```
`ask` is the immediate question: it should be specific, self-contained, and written in natural language.
`goal` is optional and describes the broader end goal you are ultimately trying to accomplish on behalf of the user. GitBook uses it to tailor the answer towards what is most useful for that goal.
The response will contain a direct answer to the question and relevant excerpts and sources from the documentation.
Use this mechanism when the answer is not explicitly present in the current page, you need clarification or additional context, or you want to retrieve related documentation sections.