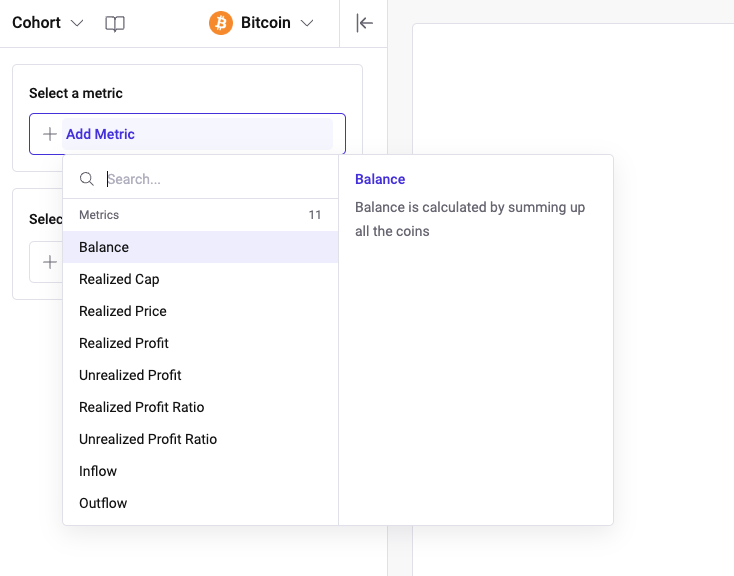
Step 1 : Select a metric
Step 1 : Select a metric
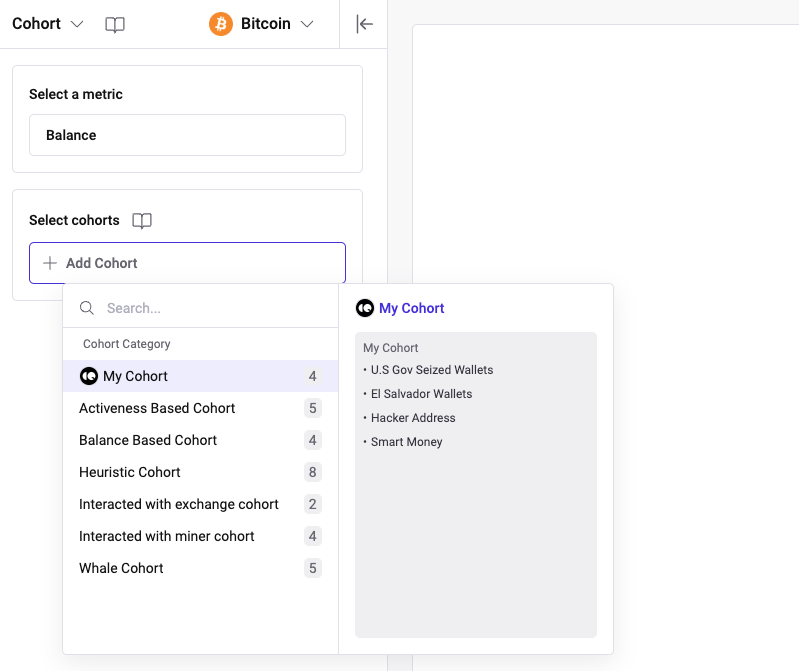
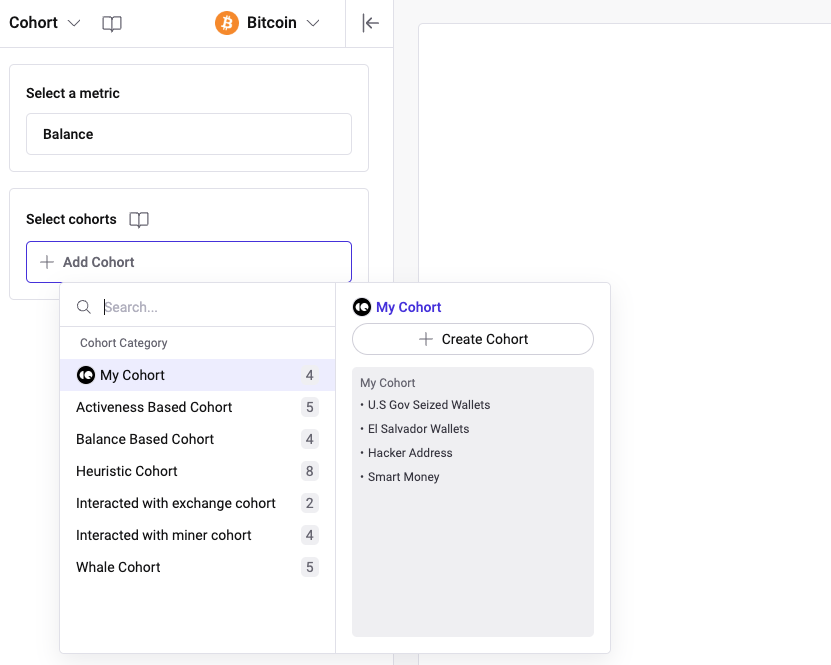
Step 2 : Select a pre-defined cohort
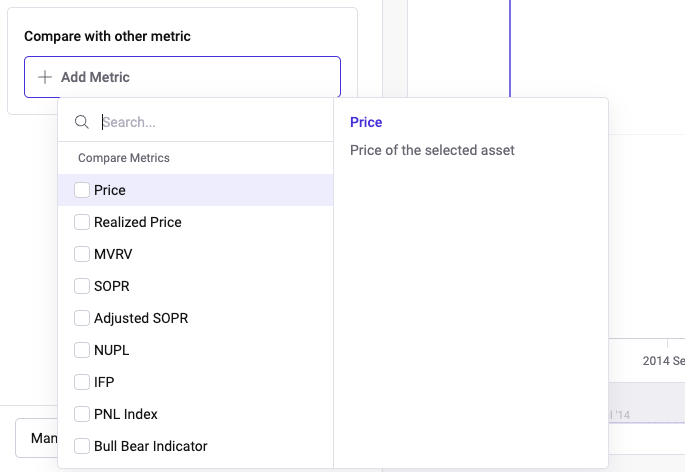
Step 3 : Select a metric to compare with cohort data
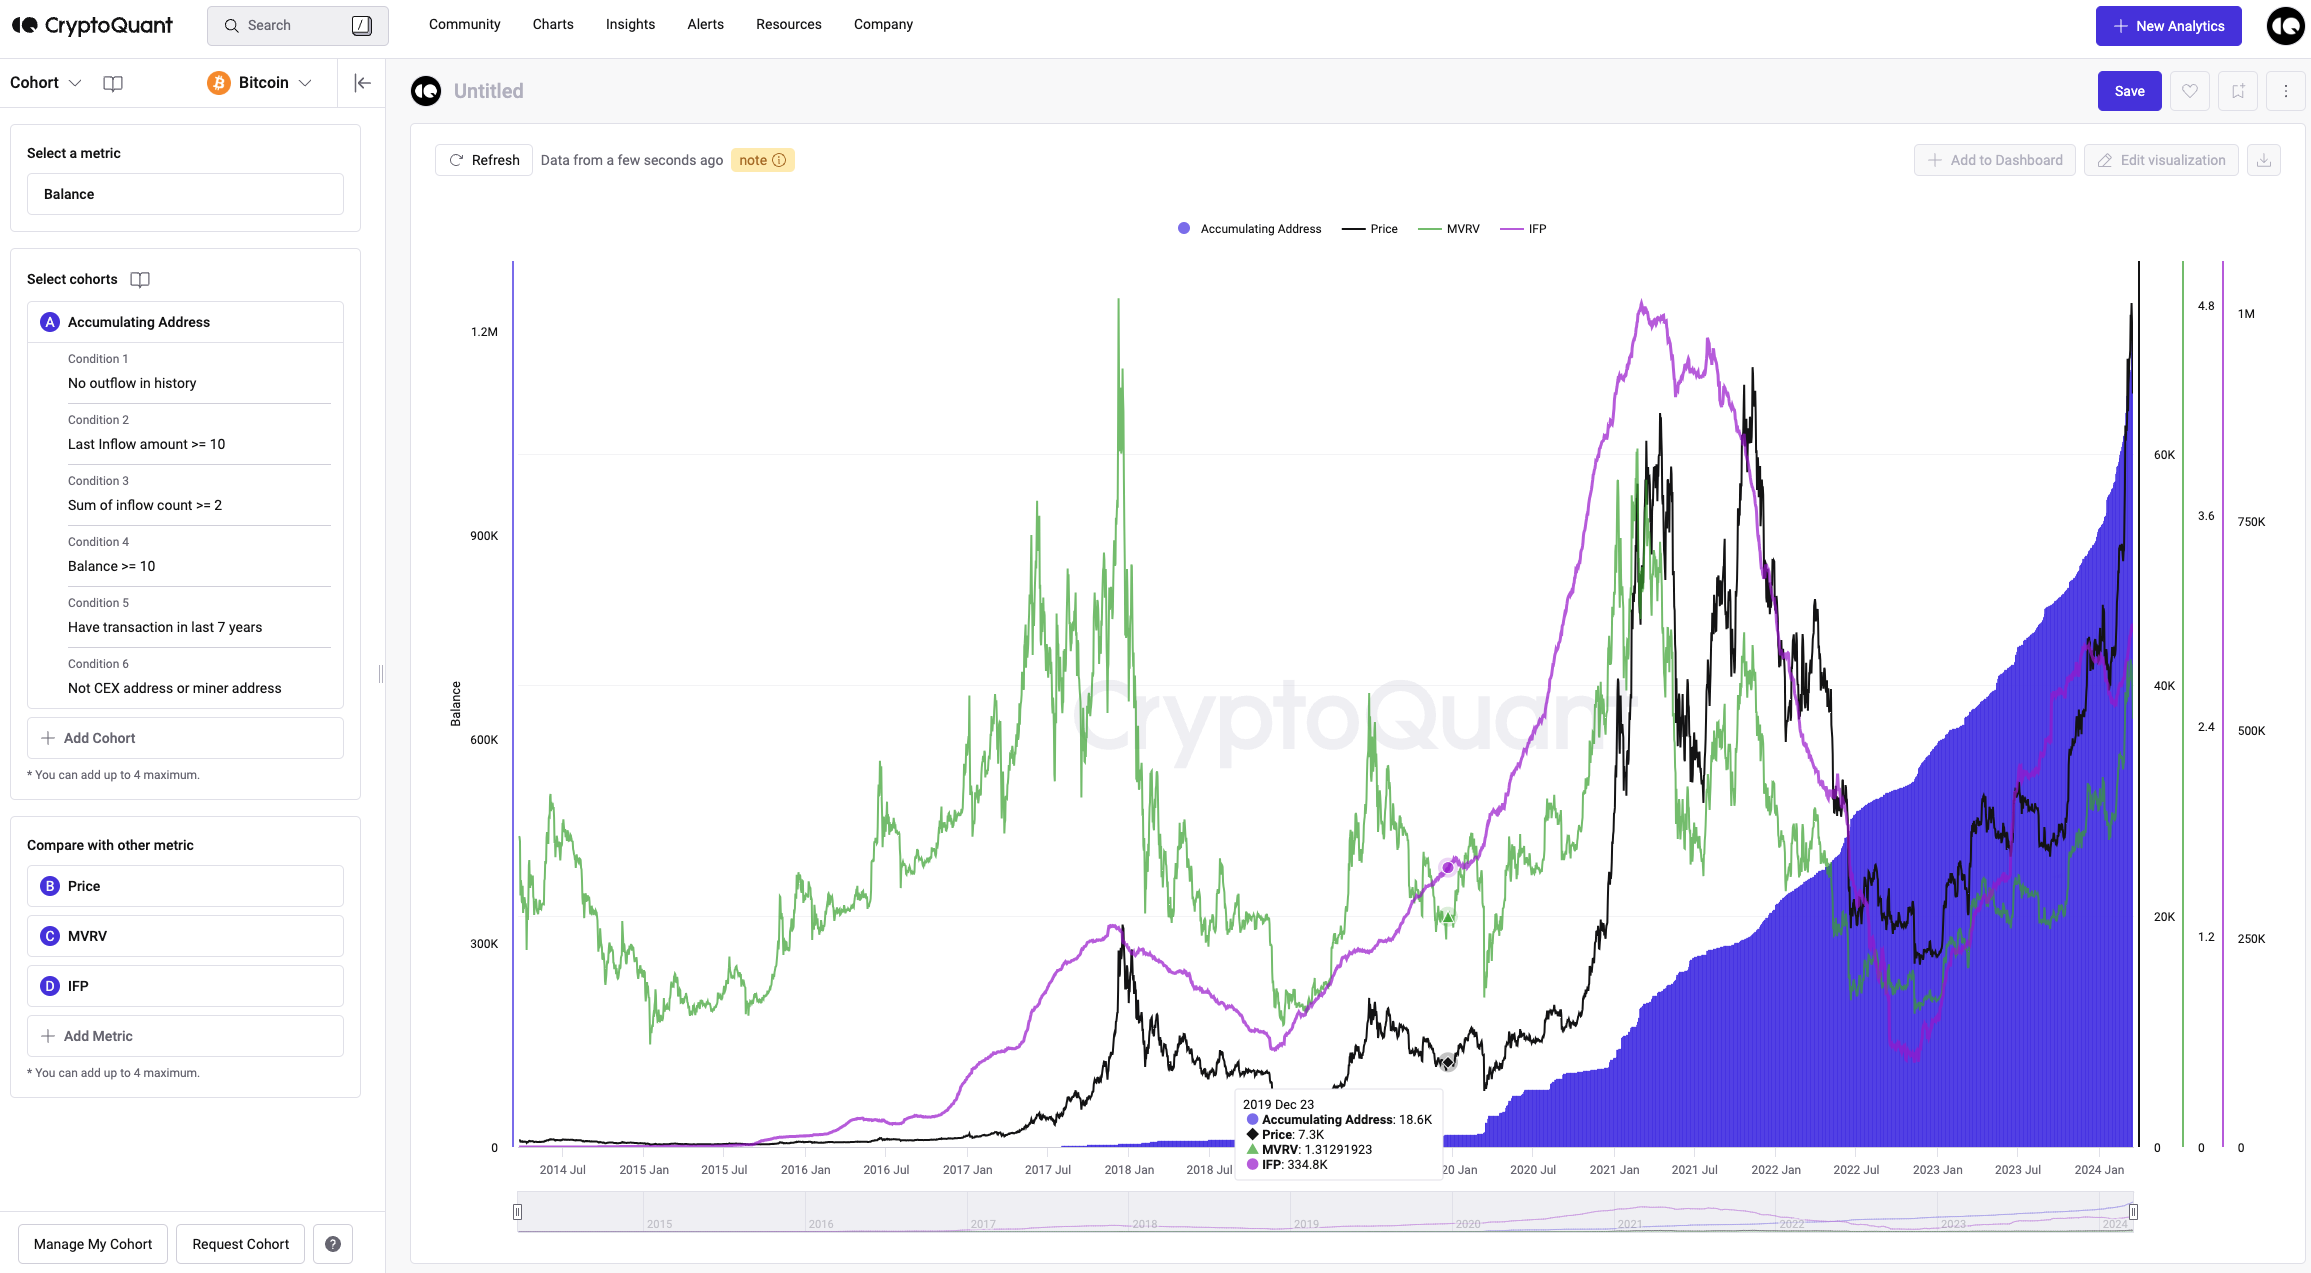
Step 4 : Start analysing the cohort data
Step 1 : Click create cohort or manage my cohort button
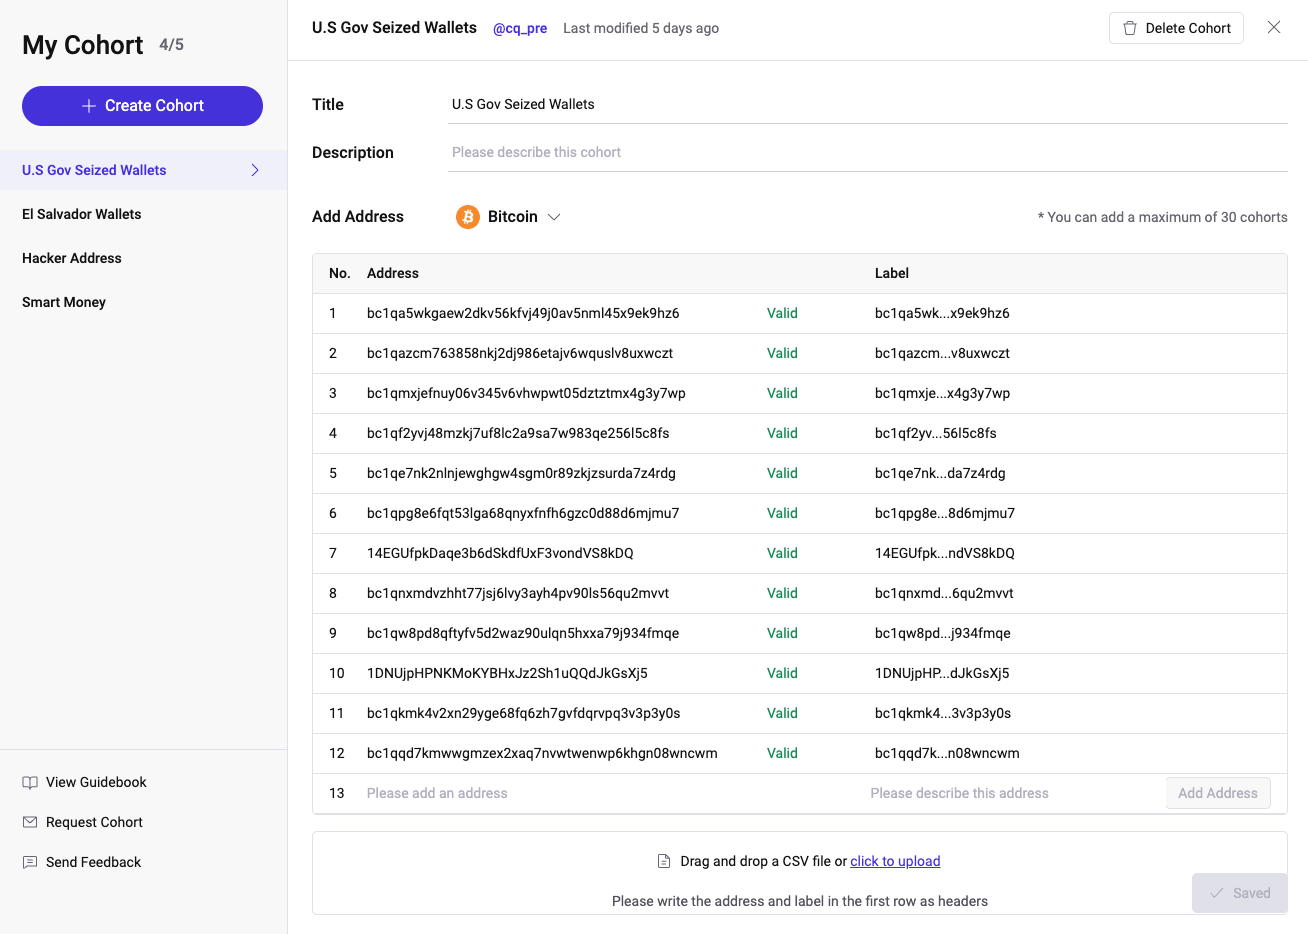
Step 2 : Add cohort title and wallet addresses belongs to the cohort
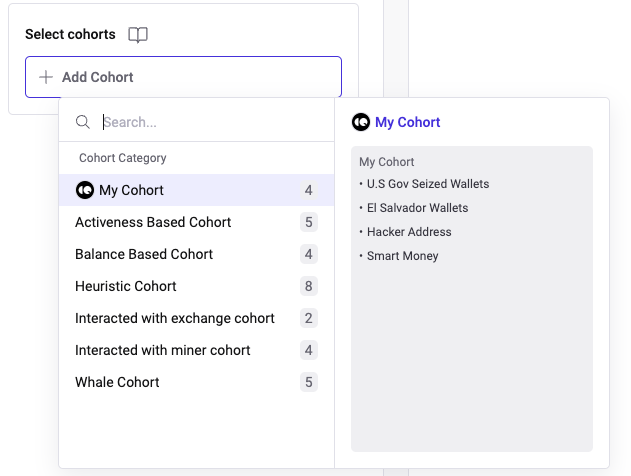
Step 3 : Check your own cohort on the cohort menu
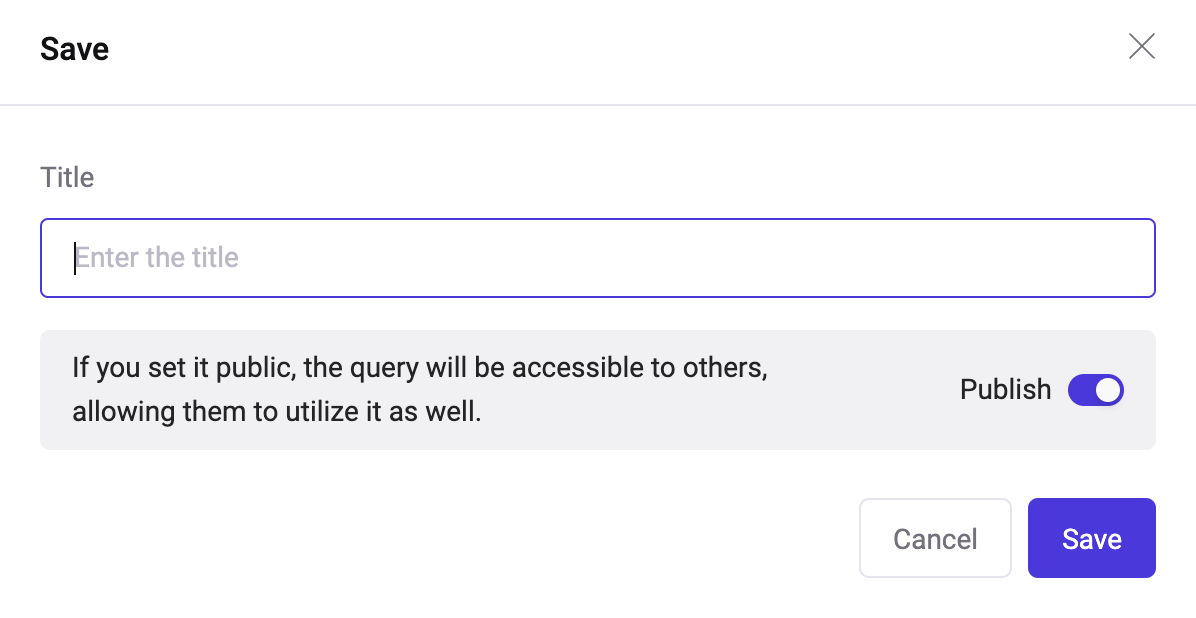
Step 1 : Save and publish your cohort analysis
Step 2 : You can see the saved cohort in My Creations page
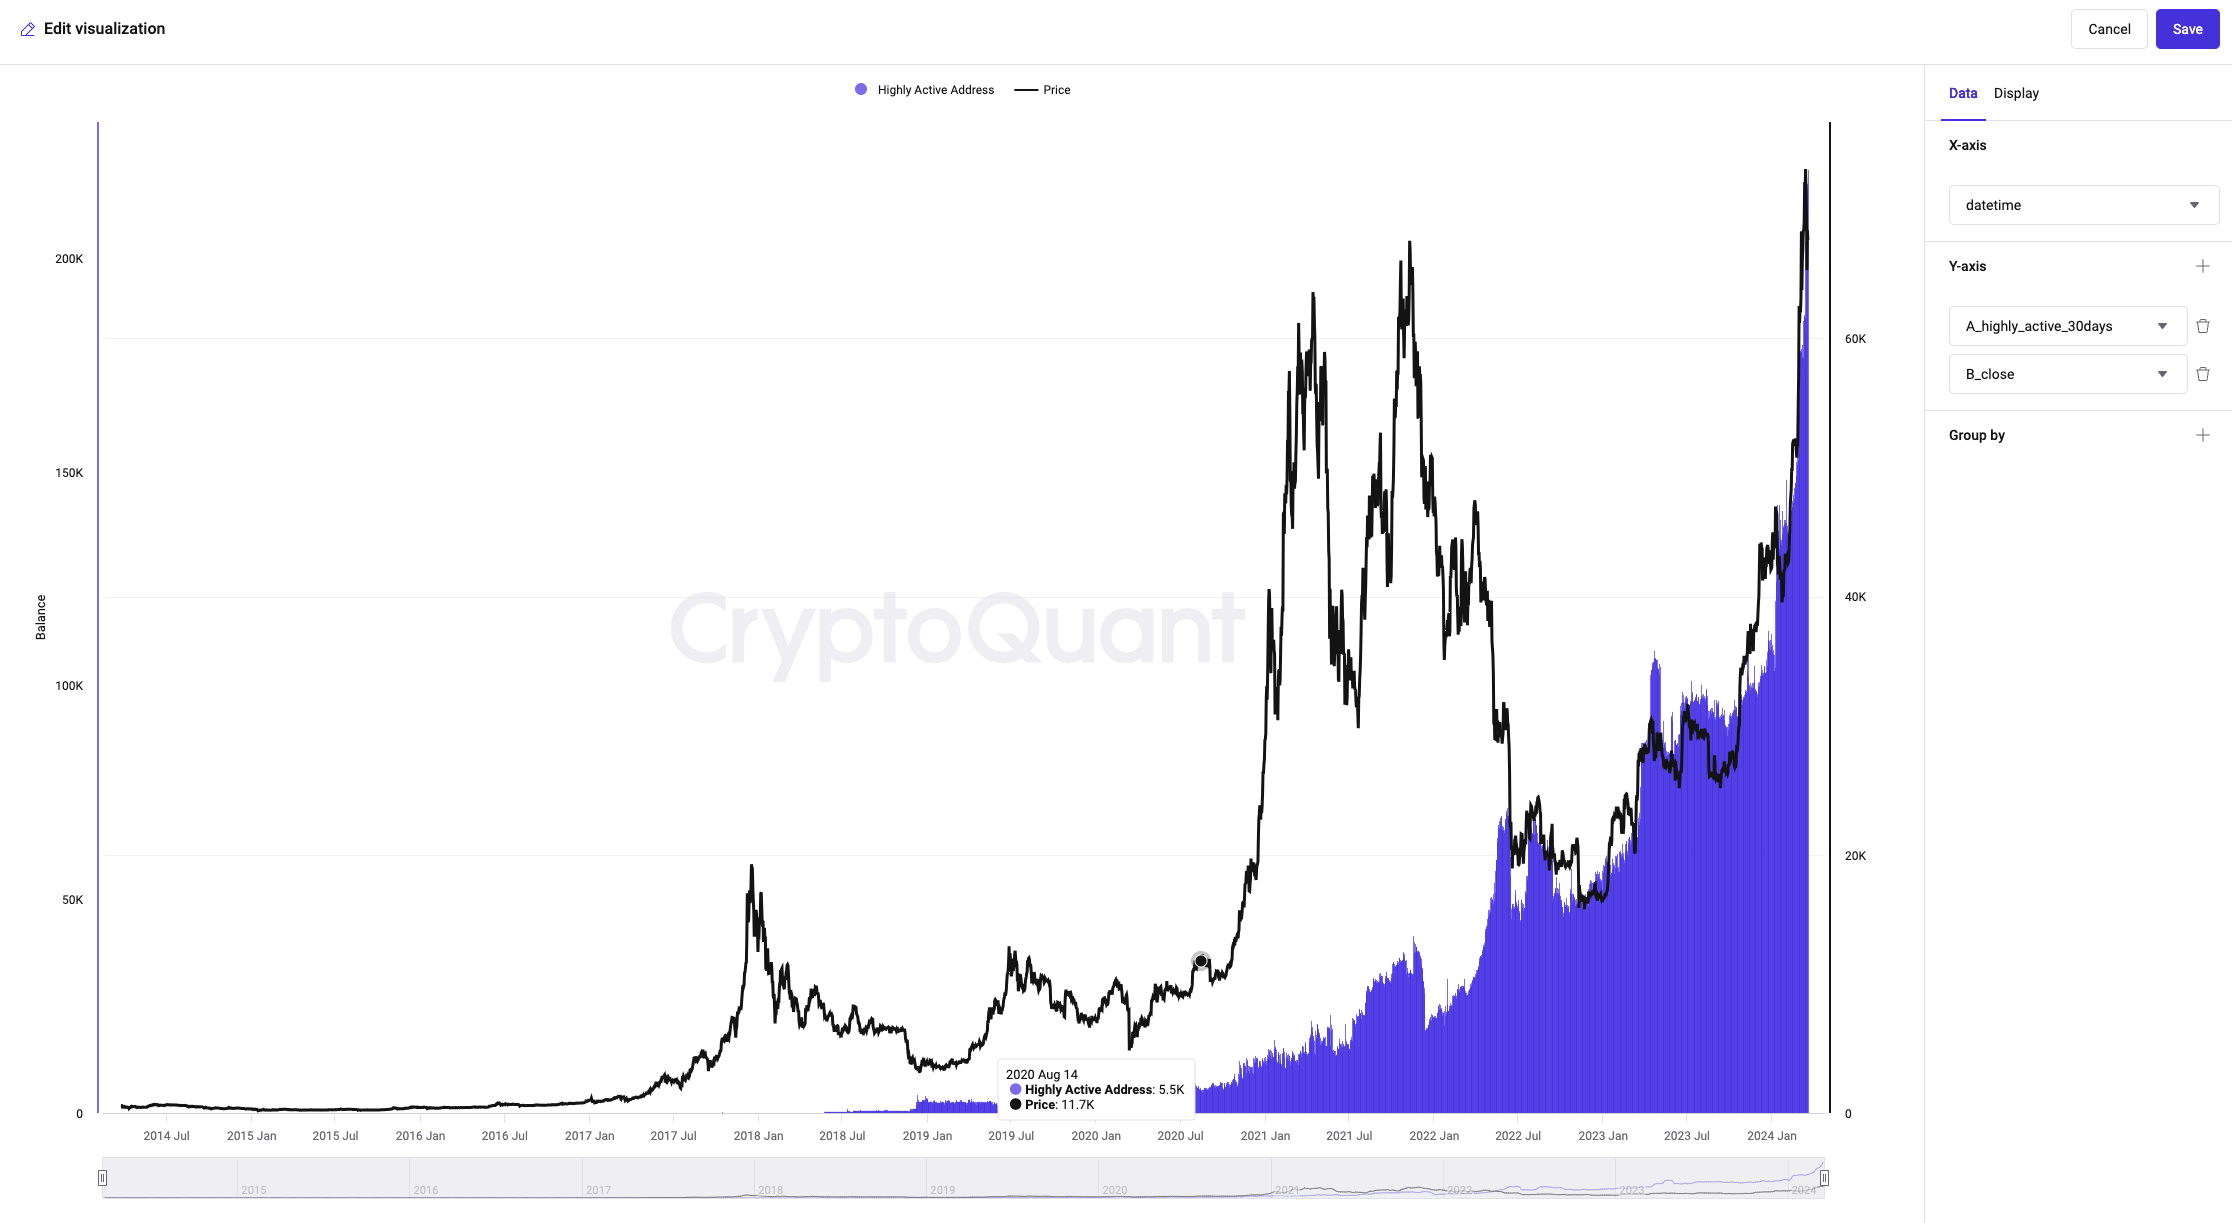
Step 3 : Edit the chart
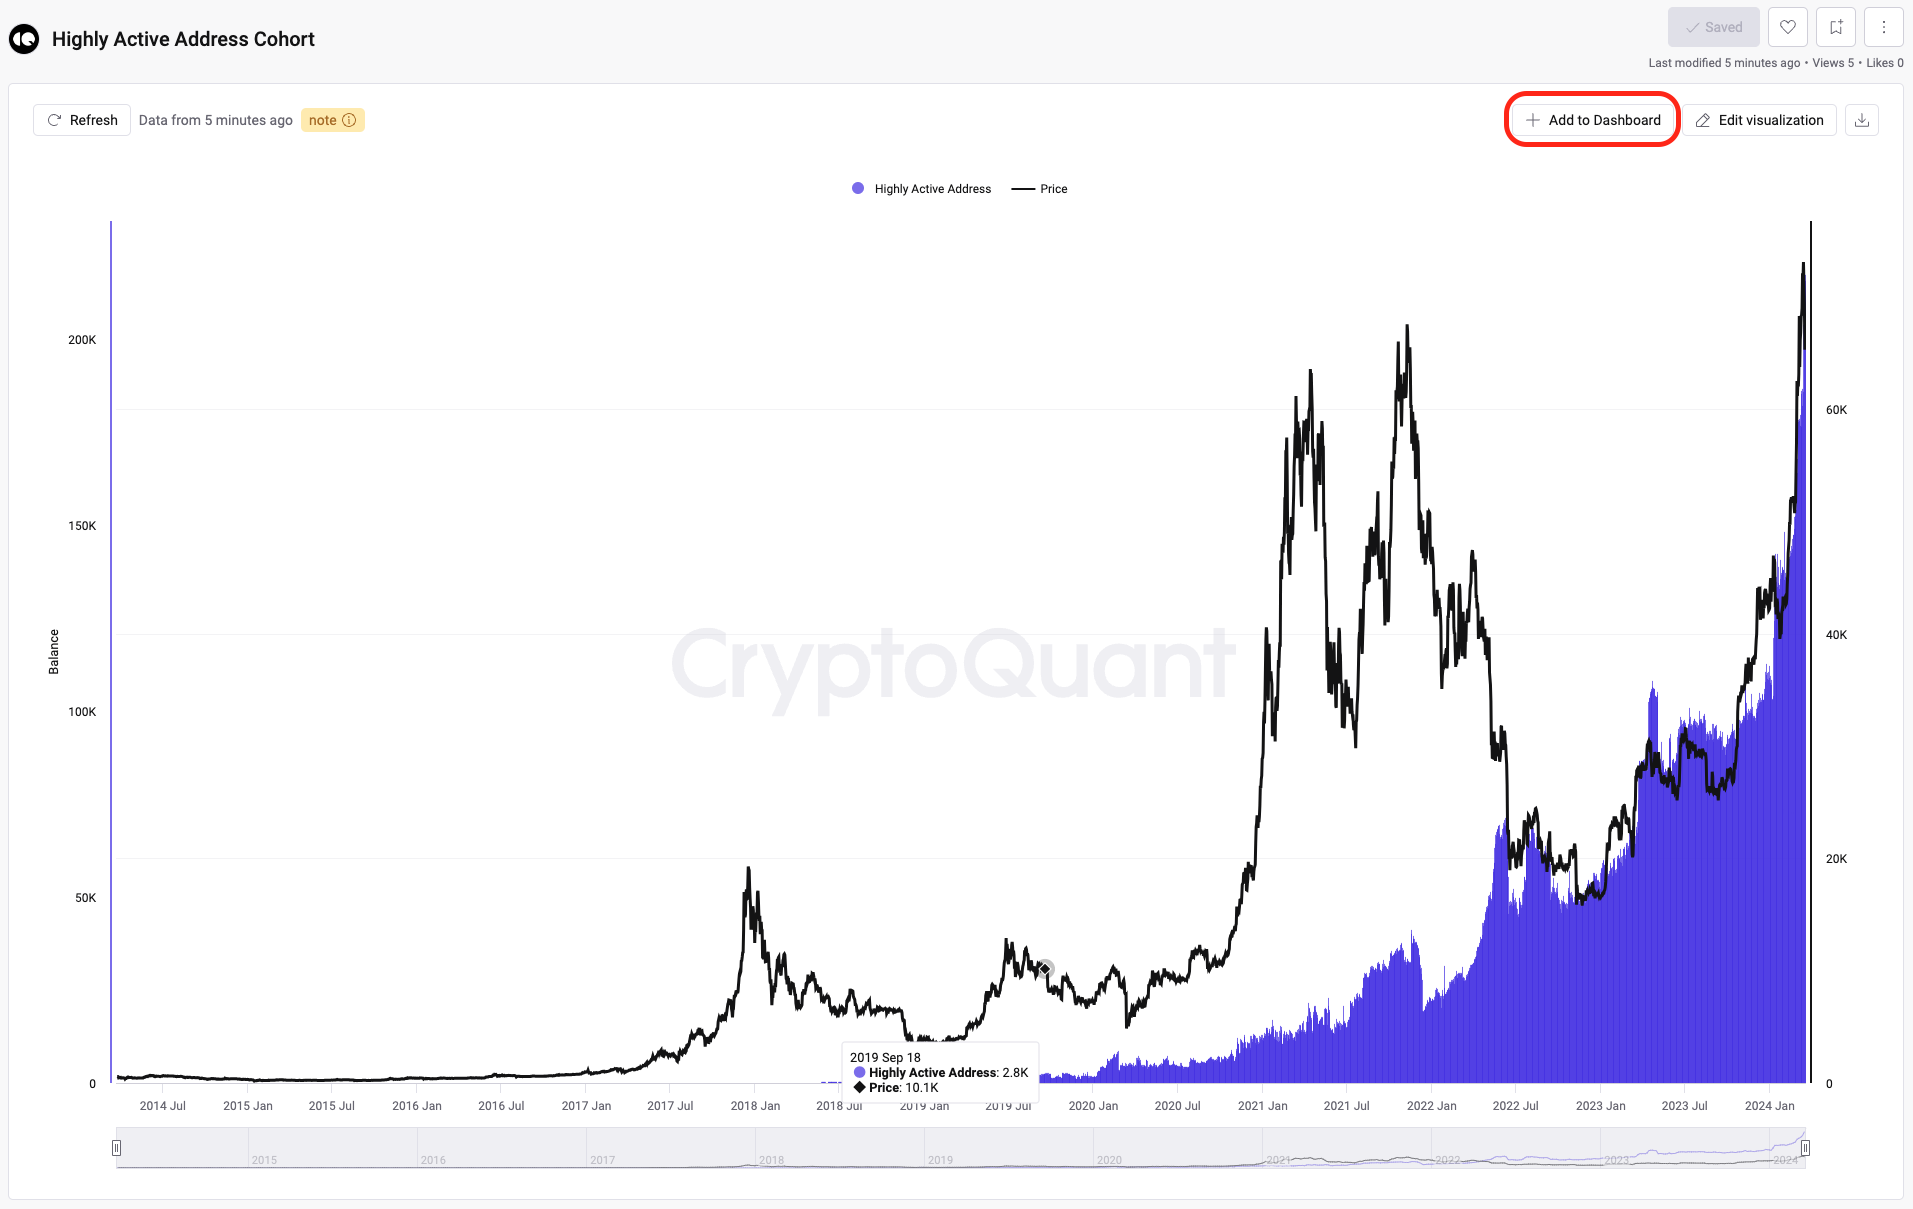
Step 4 : Cohort chart can also be added to your dashboard