> For the complete documentation index, see [llms.txt](https://userguide.cryptoquant.com/llms.txt). Markdown versions of documentation pages are available by appending `.md` to page URLs; this page is available as [Markdown](https://userguide.cryptoquant.com/cryptoquant-metrics/network/nvt-ratio.md).
# NVT Ratio
## Definition
There are numerous indicators that traders and investors use to make informed decisions. One such indicator is the Network Value to Transactions (NVT) Ratio. In this guide, we'll delve into the NVT Ratio, understand what it signifies, and explore its applications.
$$
\text{NVT Ratio} = \frac{\text{Market Cap}}{\text{Transaction Volume in USD}}
$$
### **What is NVT Ratio?**
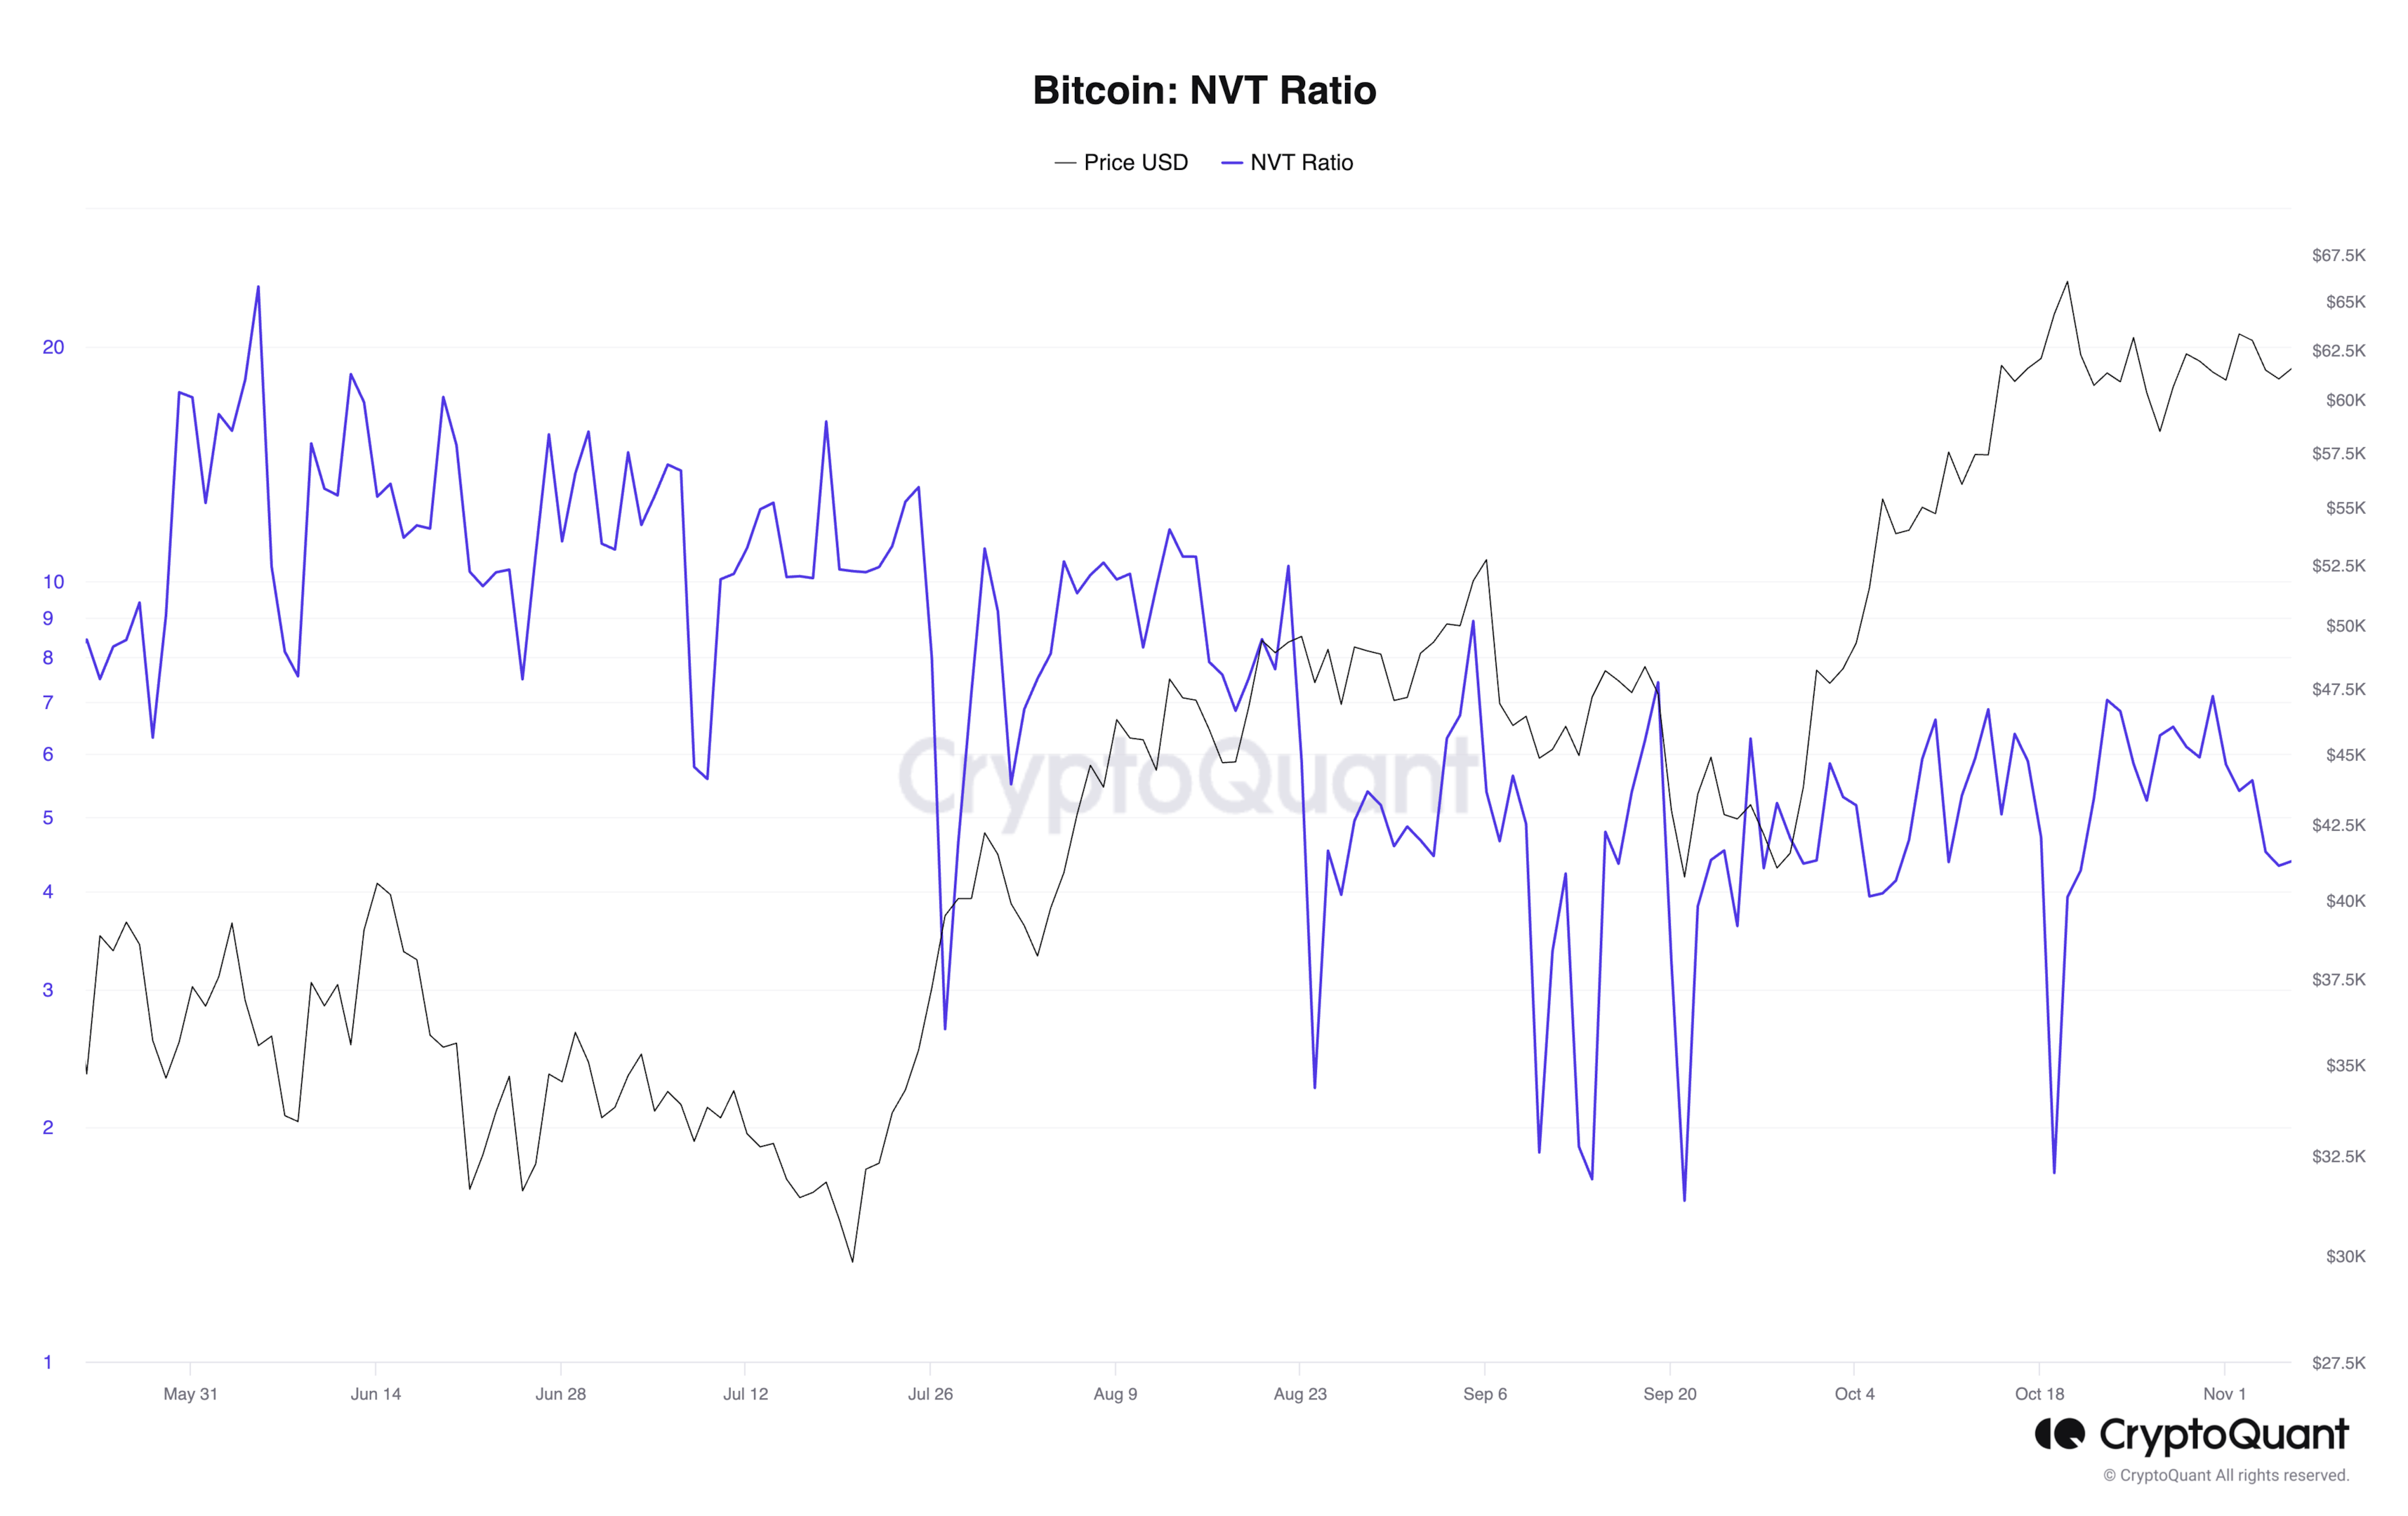
Network Value to Transactions Ratio (NVT Ratio) is defined as the ratio of market capitalization divided by transacted volume in the specified window.
### **NVT Ratio: A Conceptual Overview**
NVT can be seen as analogous to the PE Ratio (Price-Earnings Ratio) but applied in the crypto world. It is a measure of how investors perceive the cryptocurrency's value in relation to its utility, specifically in terms of transaction volume. The NVT Ratio helps us answer the fundamental question: Is the network's market cap justified by its transaction activity?
If the value is too high, it means the network is overvalued compared to the low ability to transact coins in terms of volume, implying the possible removal of a coming price bubble. This interpretation is based on the effect of [mean reversion](https://en.wikipedia.org/wiki/Mean_reversion_\(finance\)).
### **Interpreting** Network Value to Transaction **Ratio**
Understanding the interpretation of the NVT Ratio is crucial. This indicator measures whether the blockchain network is **overvalued or not**. Here's how to decipher this essential indicator:
#### *High NVT Ratio*
**High Overvalued** Network Worth = **Bearish.**
A high NVT Ratio suggests that the cryptocurrency network is being priced at a premium. This often coincides with periods of market exuberance, where market cap growth outpaces transaction volume. Such periods have historically been associated with market tops and potential overvaluation.
#### *Low NVT Ratio*
**Low Undervalued** Network Worth = **Bullish.**
Conversely, a low Network Value to Transactions Ratio indicates that the network is priced at a discount. This suggests that transaction volume and network utilization outpace market cap growth. Historically, this has been linked to accumulation opportunities and bullish trends.
#### *Stable NVT Ratio*
A consistent Network Value to Transactions Ratio signifies a balance between market cap growth and transaction volume. It often indicates that the market trend is sustainable and may persist.
### **Evolving Interpretation over Time**
The interpretation of the NVT Ratio evolves as the cryptocurrency market matures and technology advances. Factors like the Lightning Network, shifting narratives, and rising coin prices can influence how we understand the Network Value to Transactions Ratio. Therefore, it's crucial to consider historical context and analyze trends rather than fixate on absolute values.
### **Enhancing NVT Ratio Analysis**
To capture broader trends and respond to changing market dynamics, it is recommended to apply a moving average to the NVT Ratio. This offers a more comprehensive understanding of the indicator.
### **Variations of NVT Ratios**
In addition to the standard Network Value to Transaction Ratio, there are variations that provide further insights:
#### *NVT Signal (NVTS)*
This version uses a 90-day moving average of daily transaction volume in the denominator instead of raw daily transaction volume, offering a more responsive indicator.
#### *Velocity*
Velocity measures how quickly units circulate in the network. It is calculated by dividing on-chain transaction volume by market cap, effectively being the inverse of the NVT Ratio.
## Link to Our Data
* [NVT Ratio in CryptoQuant Live Chart](https://cryptoquant.com/overview/full/198?window=day)
* [NVT Ratio in CryptoQuant Data API docs](https://cryptoquant.com/docs/#operation/getRiskIndicatorNVT)
---
# Agent Instructions
This documentation is published with GitBook. GitBook is the documentation platform designed so that both humans and AI agents can read, navigate, and reason over technical content effectively. Learn more at gitbook.com.
## Querying This Documentation
If you need additional information that is not directly available in this page, you can query the documentation dynamically by asking a question.
Perform an HTTP GET request on the current page URL with the `ask` query parameter, and the optional `goal` query parameter:
```
GET https://userguide.cryptoquant.com/cryptoquant-metrics/network/nvt-ratio.md?ask=&goal=
```
`ask` is the immediate question: it should be specific, self-contained, and written in natural language.
`goal` is optional and describes the broader end goal you are ultimately trying to accomplish on behalf of the user. GitBook uses it to tailor the answer towards what is most useful for that goal.
The response will contain a direct answer to the question and relevant excerpts and sources from the documentation.
Use this mechanism when the answer is not explicitly present in the current page, you need clarification or additional context, or you want to retrieve related documentation sections.