CryptoQuant User Guide
English
English
  • 🔍What is CryptoQuant
    • Introduction
      • How We Process Data
      • Why Trust CryptoQuant Metrics?
      • Why Market Driven?
    • Background Knowledge
      • What is On-Chain Data?
      • What are Entities?
      • What is a UTxO?
    • Our Product
  • 🎯QuickStart
    • 5 Minute Data Guide
      • 3 Key On-Chain Metrics
      • 3 Key Market Metrics
      • 3 Key Indicators
      • Deriving Insights
    • 5 Minute Feature Guide
      • 1. Charting Overview
      • 2. Set Alerts
      • 3. Dashboards
      • 4. Quicktake
      • 5. Top 15 Pro Charts
        • Miner Selling
        • Whale Accumulation
        • Large OTC deals
        • Buying/Selling Pressure
        • Market Trend
        • Market Sentiment
        • Whale Dumping
  • 📊CryptoQuant Metrics
    • Exchange Flows/Indicators
      • Exchange In/Outflow and Netflow
      • Exchange Reserve
      • Exchange to Exchange
      • Exchange Addresses Count
      • Exchange Transactions Count
      • Fund Flow Ratio
      • Exchange Supply Ratio
      • Exchange Inflow CDD
      • Exchange Inflow - Spent Output Age Bands
      • Exchange Inflow - Spent Output Value Bands
    • Miner Flows/Indicators
      • Miner Outflow
      • Miner to Exchange
      • Miners' Position Index (MPI)
      • Miner Supply Ratio
    • UTxO Data/Indicators
      • Profit and Loss (UTxO)
      • Profit and Loss (Supply)
      • Coin Days Destroyed (CDD)
      • Binary CDD
      • Mean Coin Age (MCA)
      • Sum Coin Age (SCA)
      • Sum Coin Age Distribution (SCA Distribution)
      • Spent Output Profit Ratio (SOPR)
        • aSOPR (Adjusted SOPR)
        • STH-SOPR
        • LTH-SOPR
        • SOPR Ratio (LTH-SOPR/STH-SOPR)
      • Net Unrealized Profit/Loss (NUPL)
      • UTXO Bands (Age)
        • UTXO Age Bands
        • Realized Cap - UTXO Age Bands
        • Realized Price - UTXO Age Bands
        • UTXO Count - Age Bands
        • Spent Output Age Bands
      • UTXO Bands (Value)
        • UTXO Value Bands
        • Realized Cap - UTXO Value Bands USD
        • UTXO Count - Value Bands
        • Spent Output Value Bands
    • Market Data/Indicators
      • Open Interest
      • Funding Rates
      • Estimated Leverage Ratio
      • Taker Buy Sell Volume/Ratio
      • Capitalization models
      • Realized Price
      • Exchange Whale Ratio
      • MVRV (Market Value to Realized Value) Ratio
    • Network Indicators
      • NVT Ratio
      • NVT Golden Cross
      • Puell Multiple
      • Stock to Flow Ratio
      • Stock to Flow Reversion
      • NVM Ratio
    • Stablecoin Exchange Flows/Indicators
      • Stablecoin Network Data
      • Stablecoin Exchange In/Outflow & Netflow
      • Stablecoin Exchange Reserve
      • Stablecoin Exchange Addresses Count
      • Stablecoin Exchange Transactions Count
      • Stablecoins Ratio
      • Stablecoin Supply Ratio (SSR)
    • Fund Data & Premium
      • Grayscale Bitcoin Trust (GBTC)
        • GBTC Digital Asset Holdings
        • GBTC Premium or Discount
      • Grayscale Ethereum Trust (ETHE)
        • ETHE Digital Asset Holdings
        • ETHE Premium or Discount
      • Coinbase Premium
      • Korea Premium Index
      • Bank Supply Ratio
  • 🛠️Web3 Analytics Tool
    • Overview
    • Cohort Data Navigation
    • Query Data Navigation
    • How to Use(Query Tool)
      • 1. DateTime Aggregation
      • 2. Query Block - Metric
      • 3. Query Block - Where
      • 4. Query Block - Group by
      • 5. Query Block - Join
      • 6. Query Block - Order by
      • 7. Save and Run
      • 8. Editing the Result
      • 9. Visualization
        • Table
        • Pie
        • Serial
        • Number
        • Pivot Table
  • 📌Reference
    • FAQ
    • Community Guidelines
    • Community Links
Powered by GitBook
On this page
  • Group by
  • How to use
  • Group by Metadata
  • How to use

Was this helpful?

  1. Web3 Analytics Tool
  2. How to Use(Query Tool)

4. Query Block - Group by

Previous3. Query Block - WhereNext5. Query Block - Join

Last updated 1 year ago

Was this helpful?

Group by

The Group by section is used when you want to group the data in a table based on a certain criterion by creating multiple categories from a single column. For example, you can use it to view the total number of transactions sent by each address, or to compare the prices of all tokens. By using Group by, you can obtain the results of the calculation of Metrics for each group segment.

One thing to note is that as soon as you add a Group by clause, you will be calculating aggregated summaries for each group segment. Therefore, when calculating metrics, you should use an aggregate function for them to avoid errors.

How to use

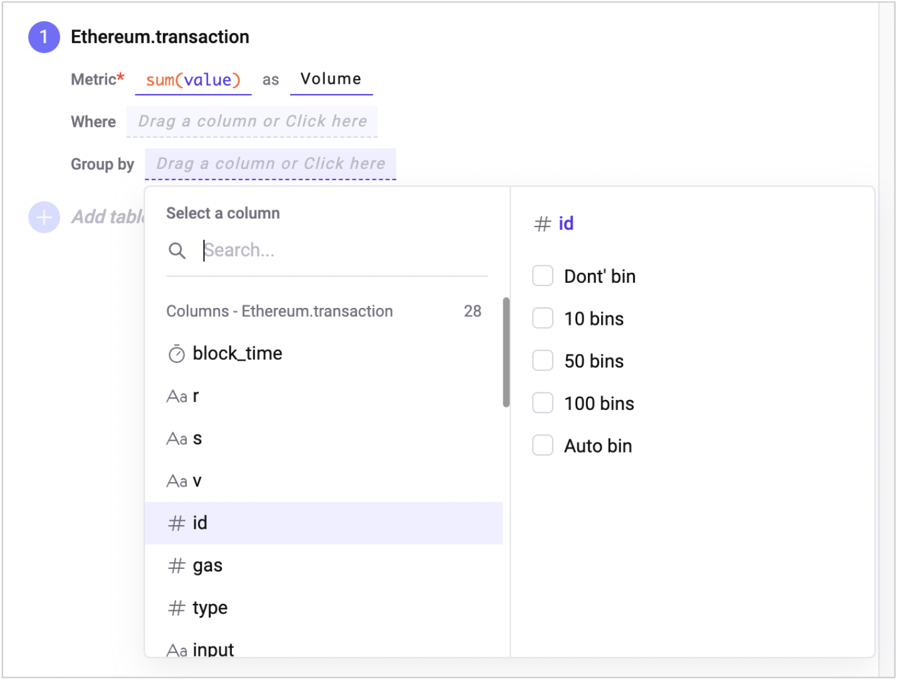
  1. You can click on the Group by input box and select the column you want to group by from the column list, or you can drag and drop the column from the left pane into the input box.

  2. For a numeric column, the bin option is provided to create groups based on the range of values. Meaning, the system will calculate and categorize the data by the number of categories that you want to see. After selecting the column, you can choose one of the bin options to complete the addition. The range of the entire numbers is divided into groups of equal size based on the number of bins selected.

  3. Adding another Group by

    1. You can add a new Group by by clicking the +Group by button at the top or dragging a column from the left pane into the Group by area.

    2. If you set multiple Group bys, you can divide the groups into subgroups to view them. Since the subgroups are formed in the order they were added, be aware of the order.

Group by Metadata

When setting up a Group by, you can use not only the data in the original table but also metadata information. For example, you can group the address column by the name of the address owner.

How to use

  1. First, select the column to use in the Group by, then select Group by Metadata from the condition dropdown.

  2. When you select it, an input field will appear asking you to choose which metadata field to match with.

    For example, if the column you want to filter corresponds to an Ethereum address, select 'Ethereum Address'.

  3. After selecting the matching field, choose which information to use to Group by. For example, if you want to group by the entity name of the address owner, select 'Entity Name'.

🛠️