9. Visualization
Visualization
We offer diverse visualization methods to present data effectively. The results can be added to a dashboard for easy management and quick viewing, or shared with the public.
Add visualization
You can create various chart visualizations from the results of your query.
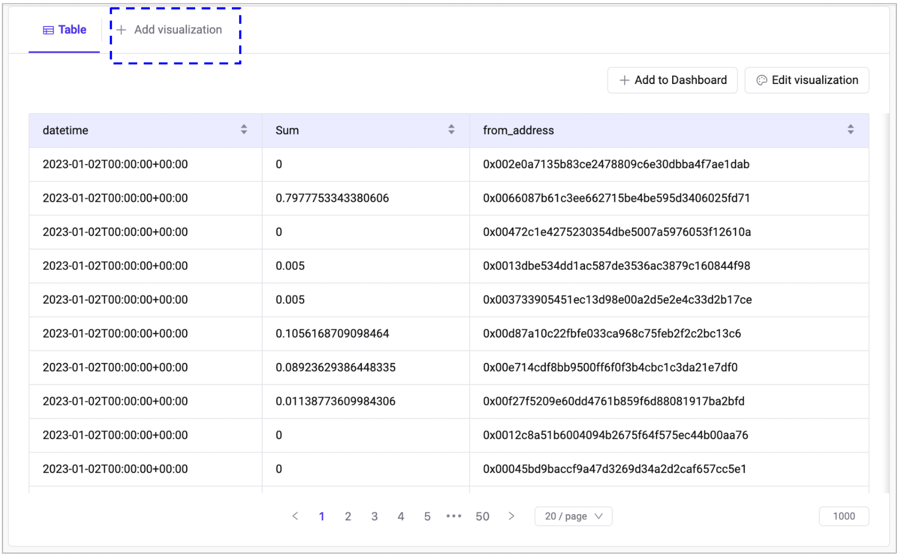
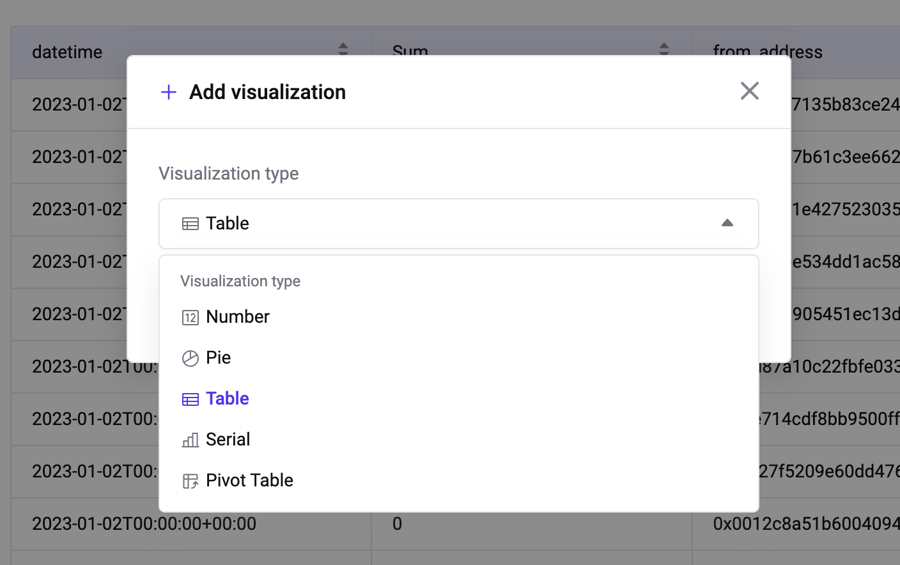
You can add a new chart visualization by clicking the "Add Visualization" button next to the Result table tab. A modal window will appear where you can choose from one of the options: table, pie, serial, number, or pivot table. The selected visualization will then be added.
Add to dashboard
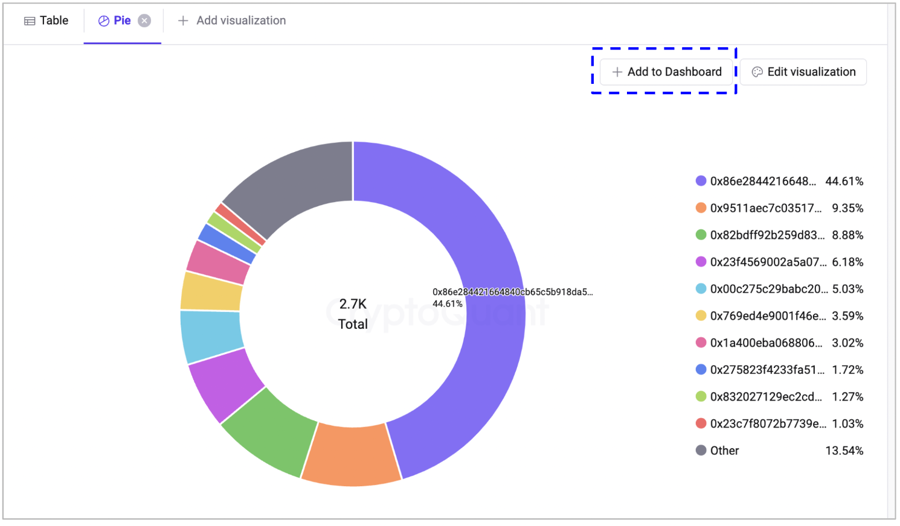
You can add the chart to one of your dashboards by clicking the "Add to dashboard" button.
Edit visualization
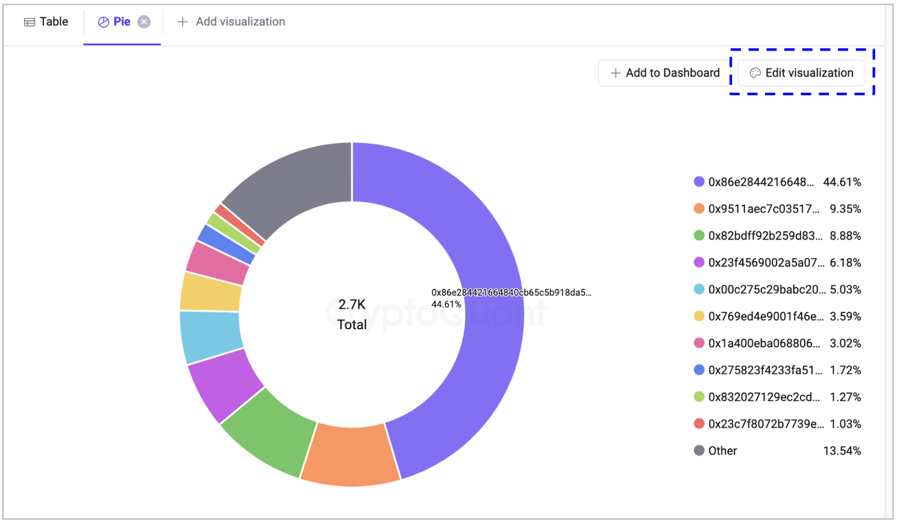
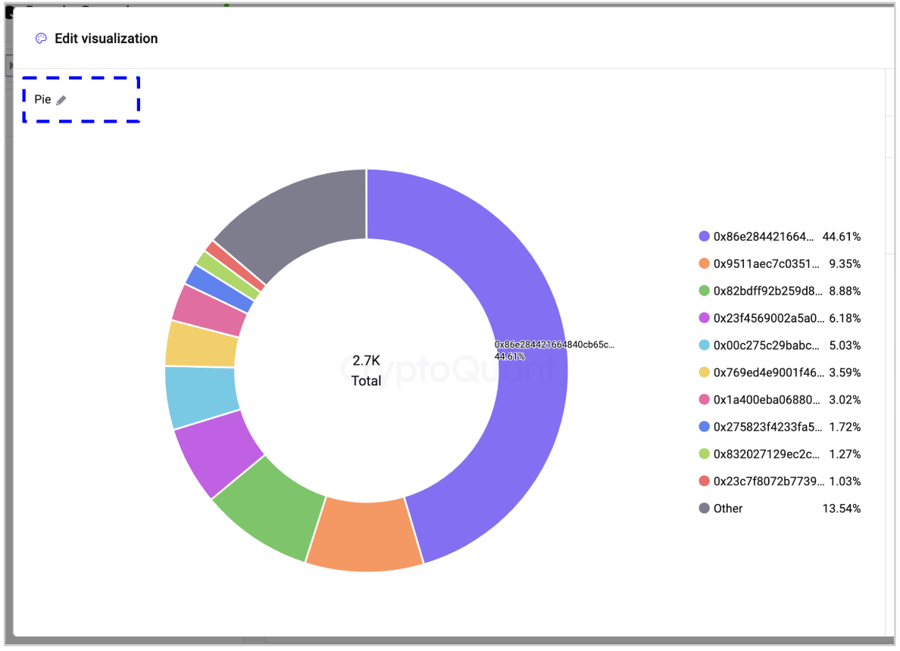
You can edit the data and display format of each chart visualization. Clicking on "Edit visualization" at the top will bring up a modal window where you can make the necessary changes.
Changing the title
When you add a chart visualization to your dashboard, it will display the title of the query by default. However, you can edit the title of an individual chart by clicking the edit button located at the top left of the modal window.
Last updated
Was this helpful?
